Multi-Timeframe Analysis: Full Framework
Multi-timeframe analysis is a framework with three roles: a higher timeframe that sets direction, a middle timeframe that sets location, and a lower timeframe that sets timing. The framework itself is simple. You run those three roles in order, every time, on every market you trade.

That is the method. Three charts, three questions, one fixed order. Everything else in this post is about doing it cleanly.
Think of three seats at a stadium showing one game: the top deck shows the whole play, the sideline shows the matchup, and the bench shows the play call. Same game, three views, each answering a different question.
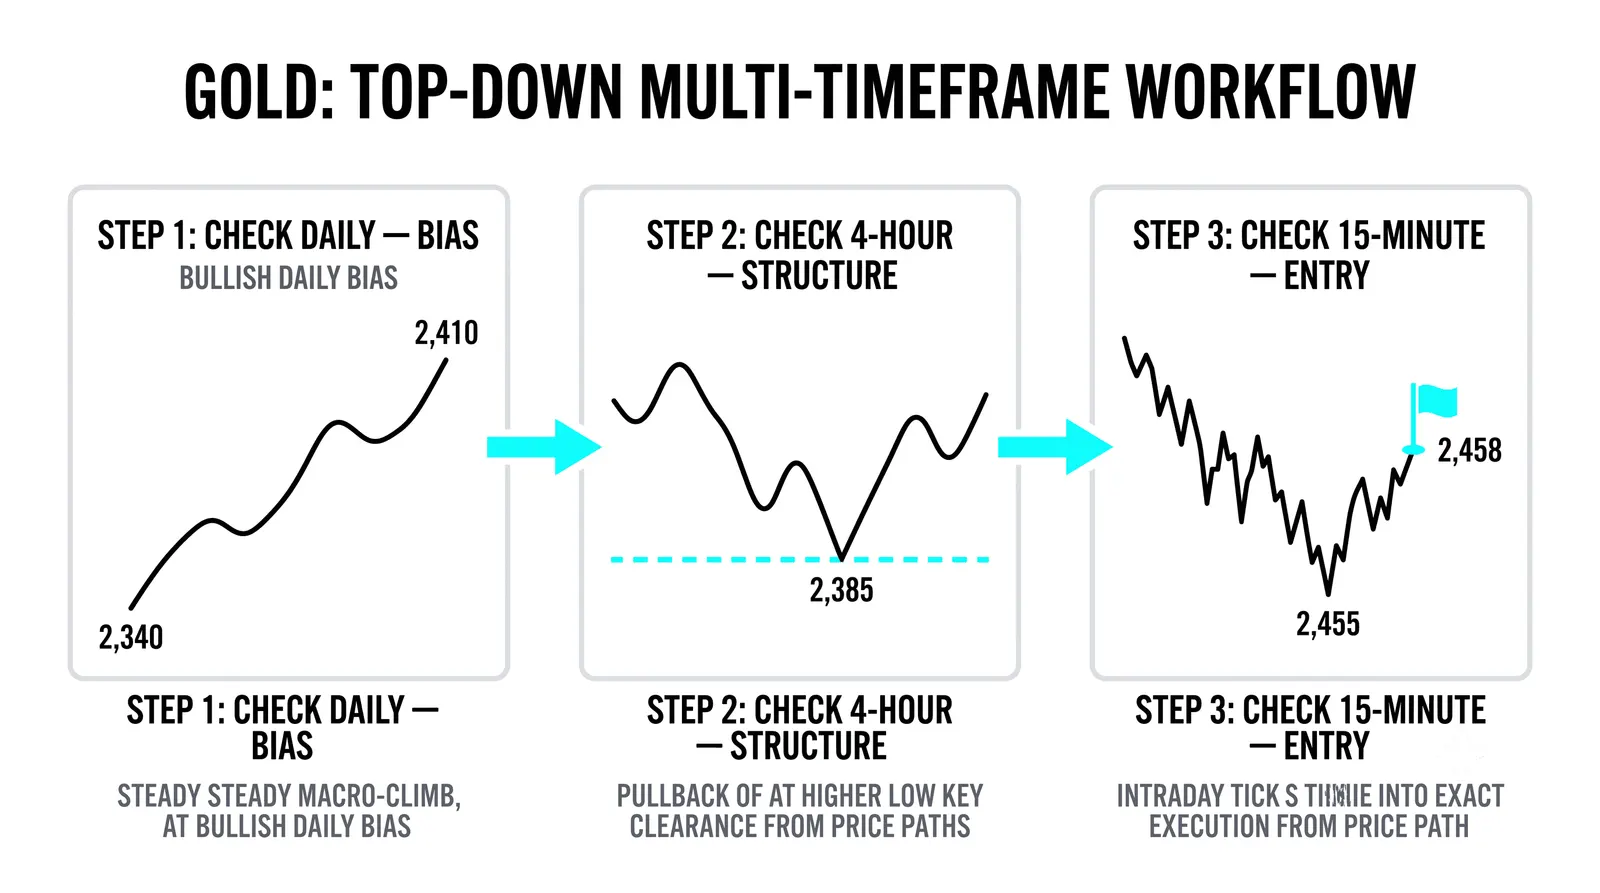
You have already met each piece of this framework in earlier lessons. One covered how higher timeframes control lower ones. One covered building a bias. One covered switching between charts without confusing yourself. One covered stacking levels across timeframes. This post does not re-teach any of those. This post is the map that shows where each piece sits and in what order you use them.
The Three Roles and Their Questions
Each timeframe in your stack has one job. It answers one question and no more. When a chart starts answering questions that belong to another chart, the framework breaks.
The higher timeframe answers direction. The question is: which way has the market been paying? You look at the swing structure. Higher highs and higher lows mean the market has been paying buyers. Lower highs and lower lows mean it has been paying sellers. This chart gives you a bias, nothing else. It does not tell you where to enter.
The middle timeframe answers location. The question is: where is price relative to the levels that matter? You take the bias from the higher chart and look for the places on this chart where that bias would be expressed. Pullbacks into support in an uptrend. Rallies into resistance in a downtrend. This chart tells you whether price is at a useful spot or stuck in the middle of nowhere.
The lower timeframe answers timing. The question is: is the moment now? Only after direction and location line up do you drop down and look for a trigger. A reversal signal, a shift in the small-scale structure, a clear rejection of the level. This chart gives you the entry, the stop placement, and the risk.
Notice what each role refuses to do. The higher timeframe never picks entries. The lower timeframe never sets bias. Keep the jobs separate and the framework stays clean.
The Order Is the Framework
Run the roles top-down, always. Direction before location. Location before timing. No exceptions, no shortcuts.
Most analysis errors are order errors. A trader sees a beautiful signal on the 15-minute chart and takes it, then wonders why it failed. The signal was fine. The problem was that the timing question got asked before the direction question. The higher timeframe was pointing the other way the whole time.
A signal against the higher-timeframe direction is noise, and the fix is to never let the lower chart speak first.
The order also protects you from over-analysis. If the higher timeframe gives no clear direction, you stop there. You do not proceed to location and timing hoping the lower charts will rescue a market that has no bias. You move on to the next market.
Choosing Your Three Timeframes
Pick timeframes that sit roughly one-to-five apart from each other. Each chart should genuinely add information. If your three charts are the 1-hour, the 45-minute, and the 30-minute, you own three copies of the same picture.
Two common stacks work for most traders:
- Swing traders: weekly for direction, daily for location, hourly for timing.
- Day traders: daily for direction, hourly for location, 15-minute for timing.
The exact numbers matter less than the spacing. Each step down should compress the view enough that new structure becomes visible. If you drop from the daily to the hourly and nothing new appears, the gap is too small. If you drop from the weekly to the 5-minute and the two charts seem to describe different planets, the gap is too wide and the middle role is missing.
Pick one stack and keep it fixed for at least a few months. Constantly reshuffling your timeframes is a quiet way of shopping for the answer you want.
What the Framework Is For
The framework converts a wall of charts into three questions with three answers. That is the practical payoff. Instead of staring at twelve monitors feeling vaguely informed, you ask three things, get three answers, and make one decision.
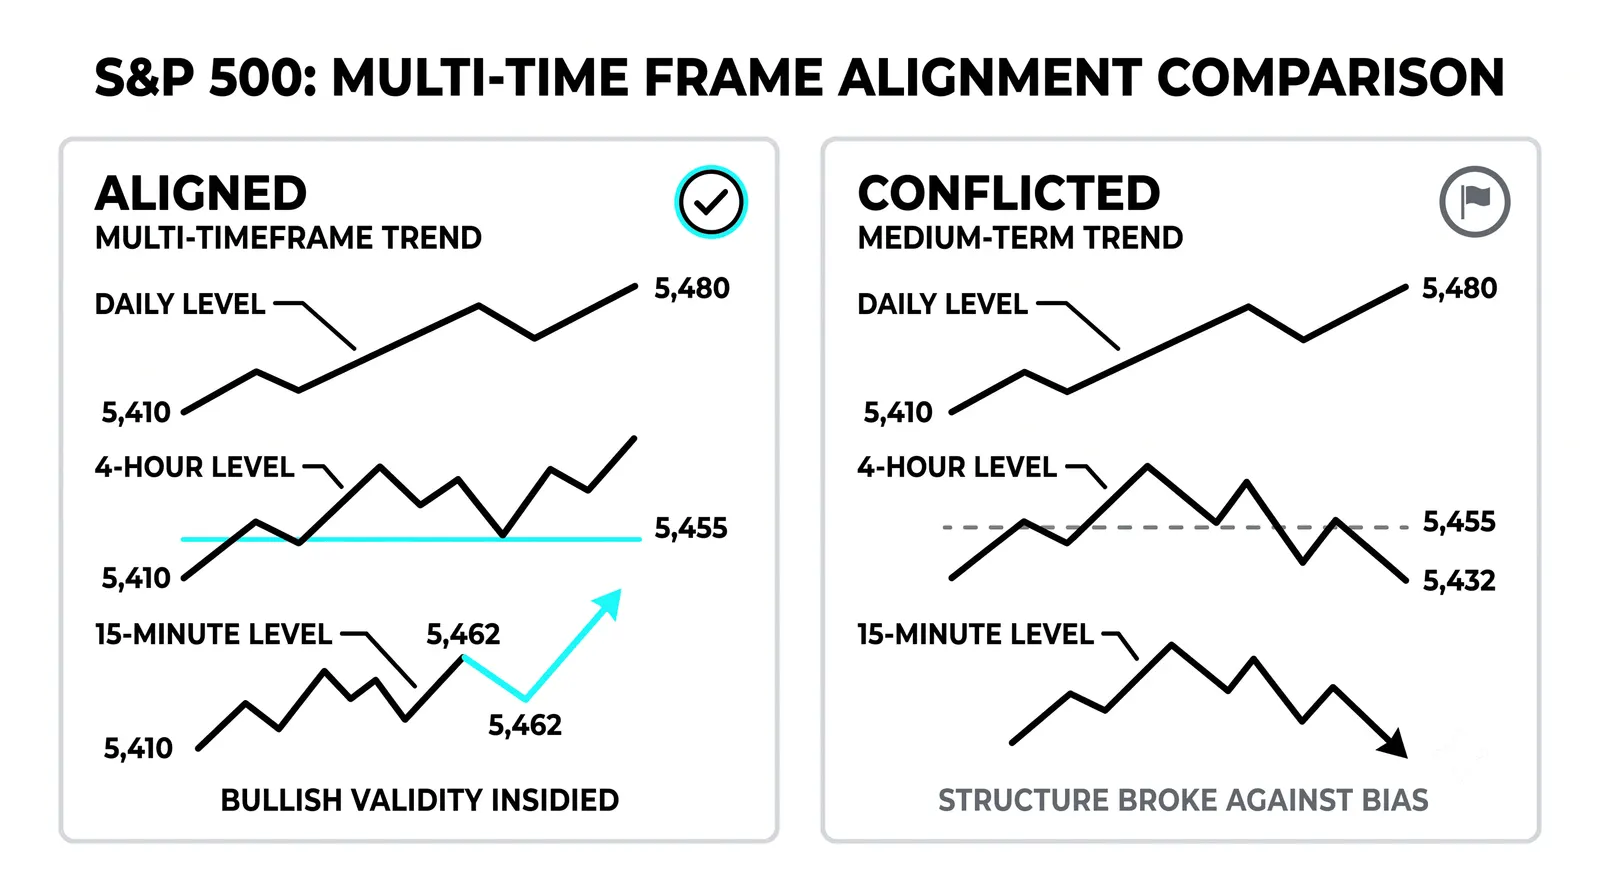
It also tells you when to do nothing. When the three answers disagree, the framework says wait. The higher timeframe says up, the middle timeframe shows price mid-range with no level nearby, the lower timeframe is chopping sideways. That is not a failed analysis. That is a completed analysis with the answer "not now."
Waiting is an output. Treat it like one. Traders who accept "no trade" as a legitimate result stop forcing entries in dead conditions, and their results usually improve for that reason alone.
No framework removes uncertainty, and this one does not promise profits. What it removes is contradiction. You stop taking longs on one chart and shorts on another in the same afternoon.
The Full Pass, Timed
Here is a hypothetical full pass on one market, with round numbers, budgeted at fifteen minutes. The point is to show how little time a structured pass takes once the roles are clear.
Minutes one to three: direction. Open the weekly chart. The market has printed higher highs and higher lows since spring. The swing structure is intact. Answer: direction is up. Bias is long. Two minutes spent, one question answered.
Minutes four to seven: location. Drop to the daily chart. Price has spent three weeks pulling back from 55 down to 51. The pullback is holding above the last daily higher low at 50, so the daily uptrend is not broken. Price is sitting at a location that matters: a pullback into prior structure, inside an intact uptrend. Answer: location is favorable for longs.
Minutes eight to twelve: timing. Drop to the hourly chart. At 51.30, the hourly prints a reversal signal: a strong close back above the level after dipping below it, with the small-scale structure shifting to higher lows. Answer: the moment is now, or close to it.
Minutes thirteen to fifteen: write it down. Three answers, one decision. The plan goes on paper:
- Bias: long, from the weekly structure.
- Entry: near 51.50, just above the hourly reversal.
- Stop: 50.20, below the daily higher low at 50. Risk is roughly 1.30 per share.
- First target: the prior high at 55, roughly 3.50 of reward against 1.30 of risk.
Fifteen minutes. Three roles, three answers, one decision, written down before any order is placed. If any step had failed, say the daily had broken below 50, the pass would have ended at that step with a "no trade" written down instead. That is a completed pass too.
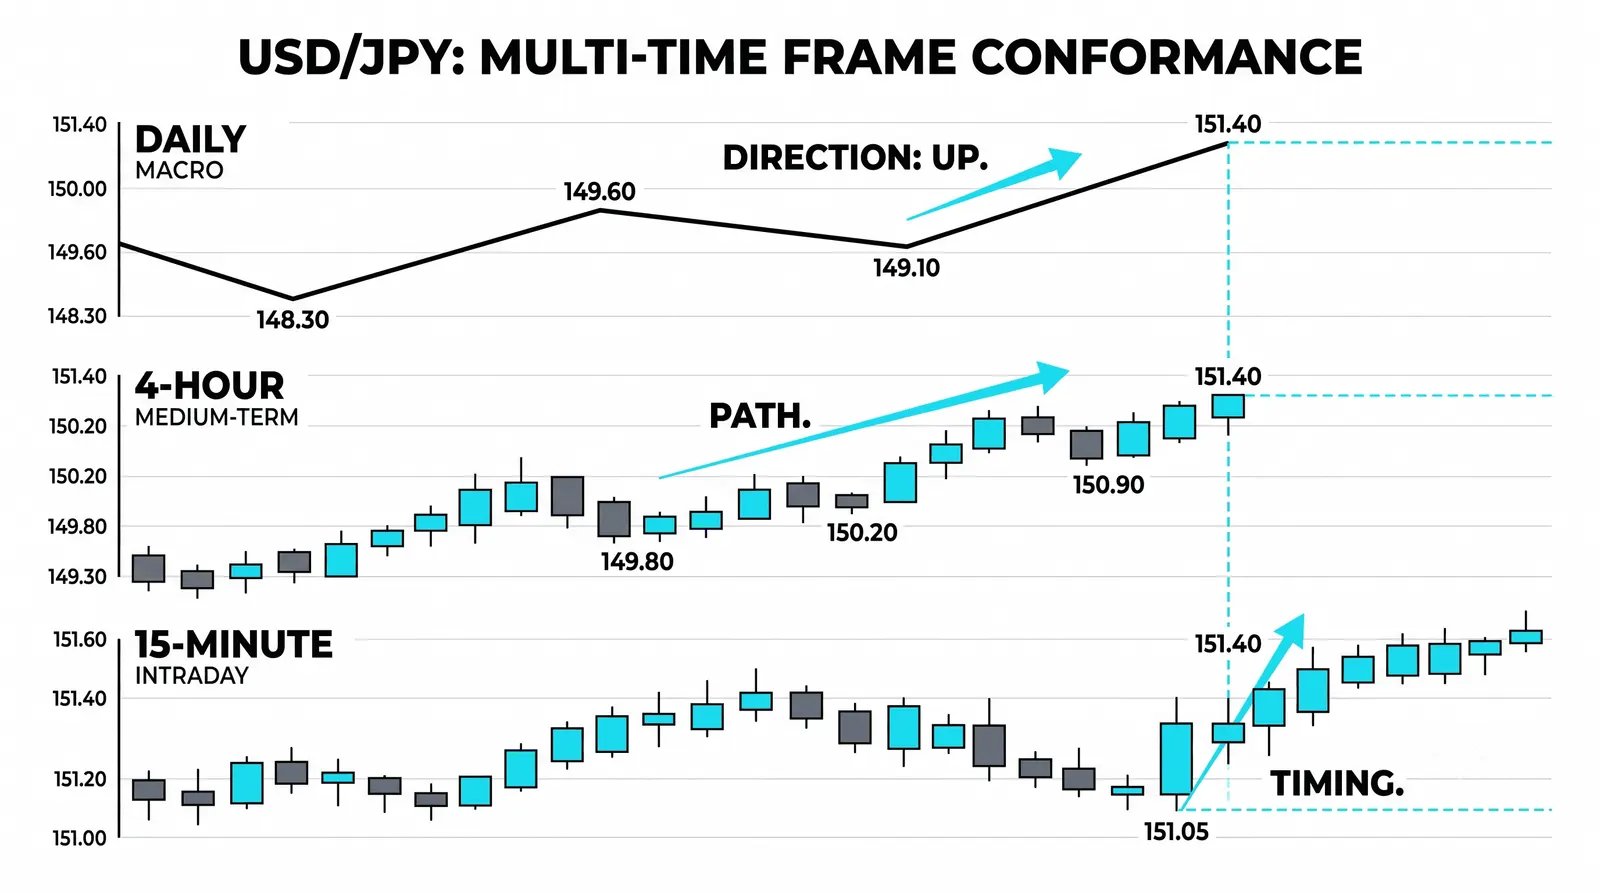
Run this same sequence on every market you watch. The markets change. The questions never do.
The Multi-Timeframe Framework, Answered
Can I use two timeframes instead of three?
Yes, but you give up one role, so know which one. Most two-chart traders keep direction and timing and drop location, which means they enter on signals without checking whether price sits at a meaningful level. If you run two charts, merge location into your higher-timeframe read by marking key levels there before you drop down.
What do I do when the three roles disagree?
You wait. Disagreement between the roles is the framework's way of saying the market has no clean trade right now. The higher timeframe says up, the middle chart shows price mid-range, the lower chart chops. Write "no trade" and check again after the next meaningful close on your middle timeframe.
How long does a full pass take?
About fifteen minutes per market once the habit is set, as the worked example above shows. Your first few passes will take longer, maybe thirty minutes, because you are still learning to answer one question per chart without drifting. Speed comes from repetition, not from skipping steps.
Does this framework work for day trading?
Yes, with the stack shifted down: daily for direction, hourly for location, 15-minute for timing. The roles and the order stay identical. The only change is that a day trader's "higher timeframe" is the daily chart rather than the weekly, and the full pass often runs once before the session and once or twice during it.
Your next step is mechanical, not intellectual. Pick your stack tonight, and tomorrow run one timed pass on one market, writing down the three answers before you look at a single entry. Once the order feels automatic, the sibling lessons on bias, switching, and level-stacking will slot into their rungs without effort.