Marubozu: the Candle With No Wicks
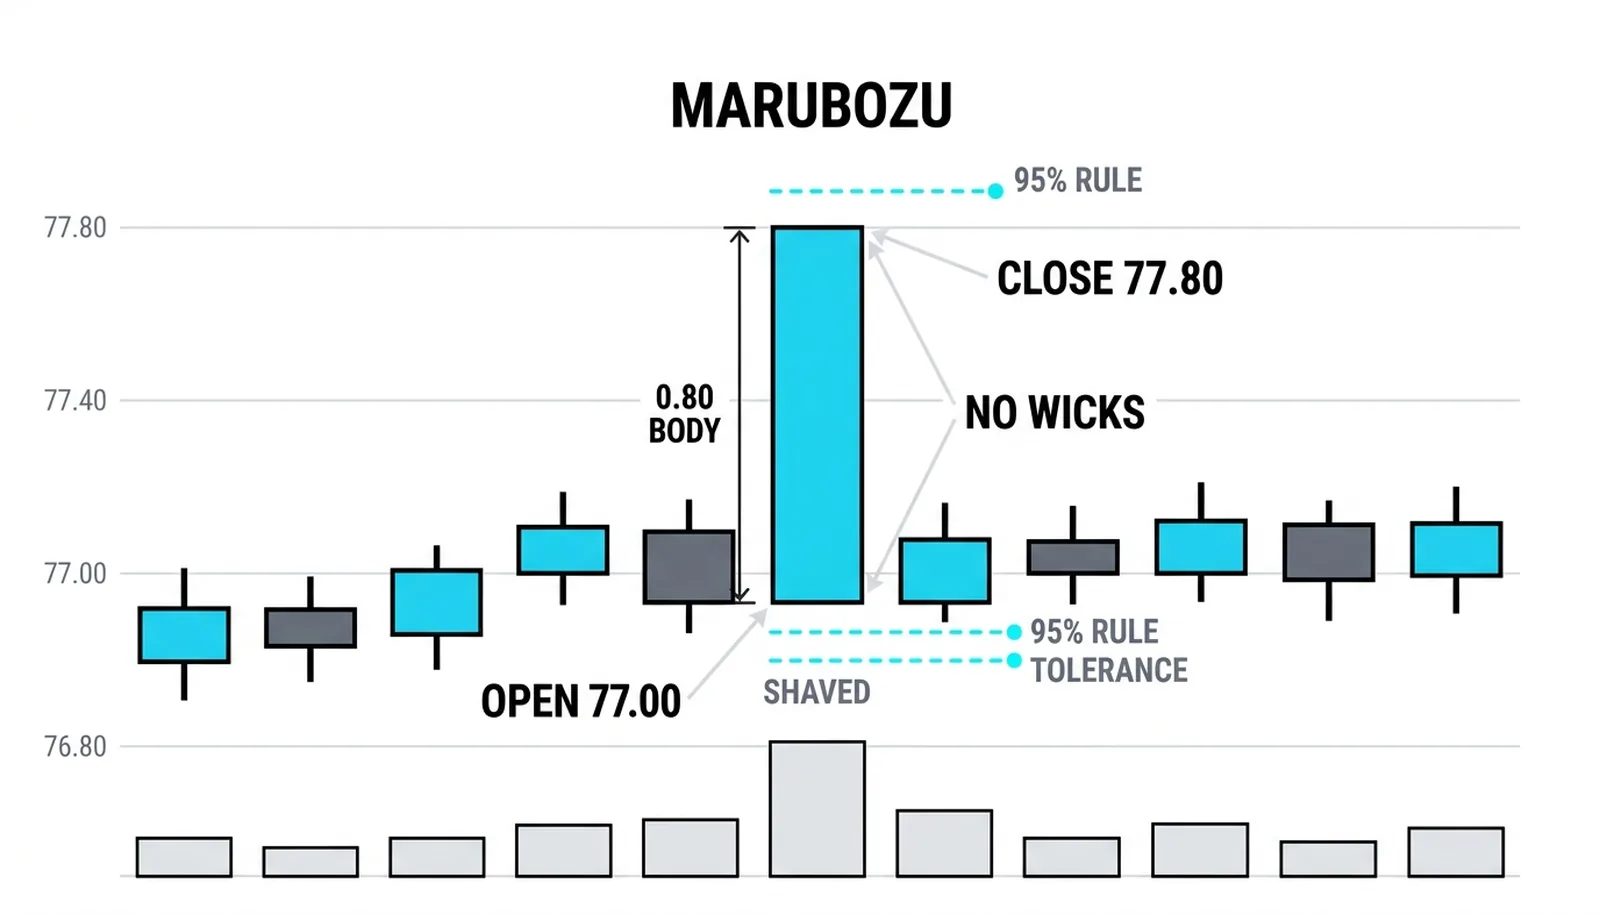
A marubozu is a candle with no wicks at all. On a bullish one, the open equals the low and the close equals the high. On a bearish one, the open equals the high and the close equals the low. One side owned the entire auction from the first tick to the last.

Think of a toothpaste tube under one thumb: steady pressure in one direction from start to finish, and nothing ever squeezes back. That is the psychology inside this shape. The last block ended with the doji, the candle of maximum indecision. The marubozu sits at the opposite end of the same spectrum, the candle of maximum conviction. Where the doji says nobody won, this one says somebody won everything.
The Shape, Exactly
The structure is simple to state. The body spans the entire high-to-low range. Open at one extreme, close at the other, nothing left over as a wick on either end.
In real market data, strict equality almost never happens. A tolerance band is needed. Wicks of a few ticks are common, and a working rule treats anything under roughly a tenth of the range as still marubozu-family. A candle with a body covering 95 percent of its range carries the same message as a perfect print.
The name itself hints at the problem. Marubozu is Japanese for a shaved or close-cropped head. The tape-reading framework calls these bars shaved, and in that shorthand a shaved top and bottom means extreme aggression from one side.
Here is the tick-size trap most definitions skip. On fine-tick markets, the pattern almost never prints at exact decimal equality, so a strict definition hides it entirely. On currencies quoted to five decimals, a true marubozu may never appear. On the same pair quoted to four decimals, it does. That tells you something uncomfortable: the pattern is partly an artifact of how finely the market can tick. The shape is real, but the perfect version of the shape is a rounding accident.
Time frame matters too. Marubozu candles are far more common on short time frames, where the open and close have less time to wander away from the extremes. On a one-minute chart, one aggressive burst can fill the whole bar. On a daily chart, twenty-four hours of trading almost always produces at least one pushback somewhere, and that pushback leaves a wick.
What Maximum Conviction Tells You
The tell is where the close sits. A close pinned at the extreme means urgency. Buyers were unwilling to let price close anywhere but the high, right up to the final second. That is not casual interest; that is someone who wanted in and did not care about paying up.
The missing wick carries the second half of the message. No wick means nobody managed to push price back even once inside the whole period. Sellers tried nothing, or tried and got absorbed instantly. One side controlled the auction without a single visible counterpunch.
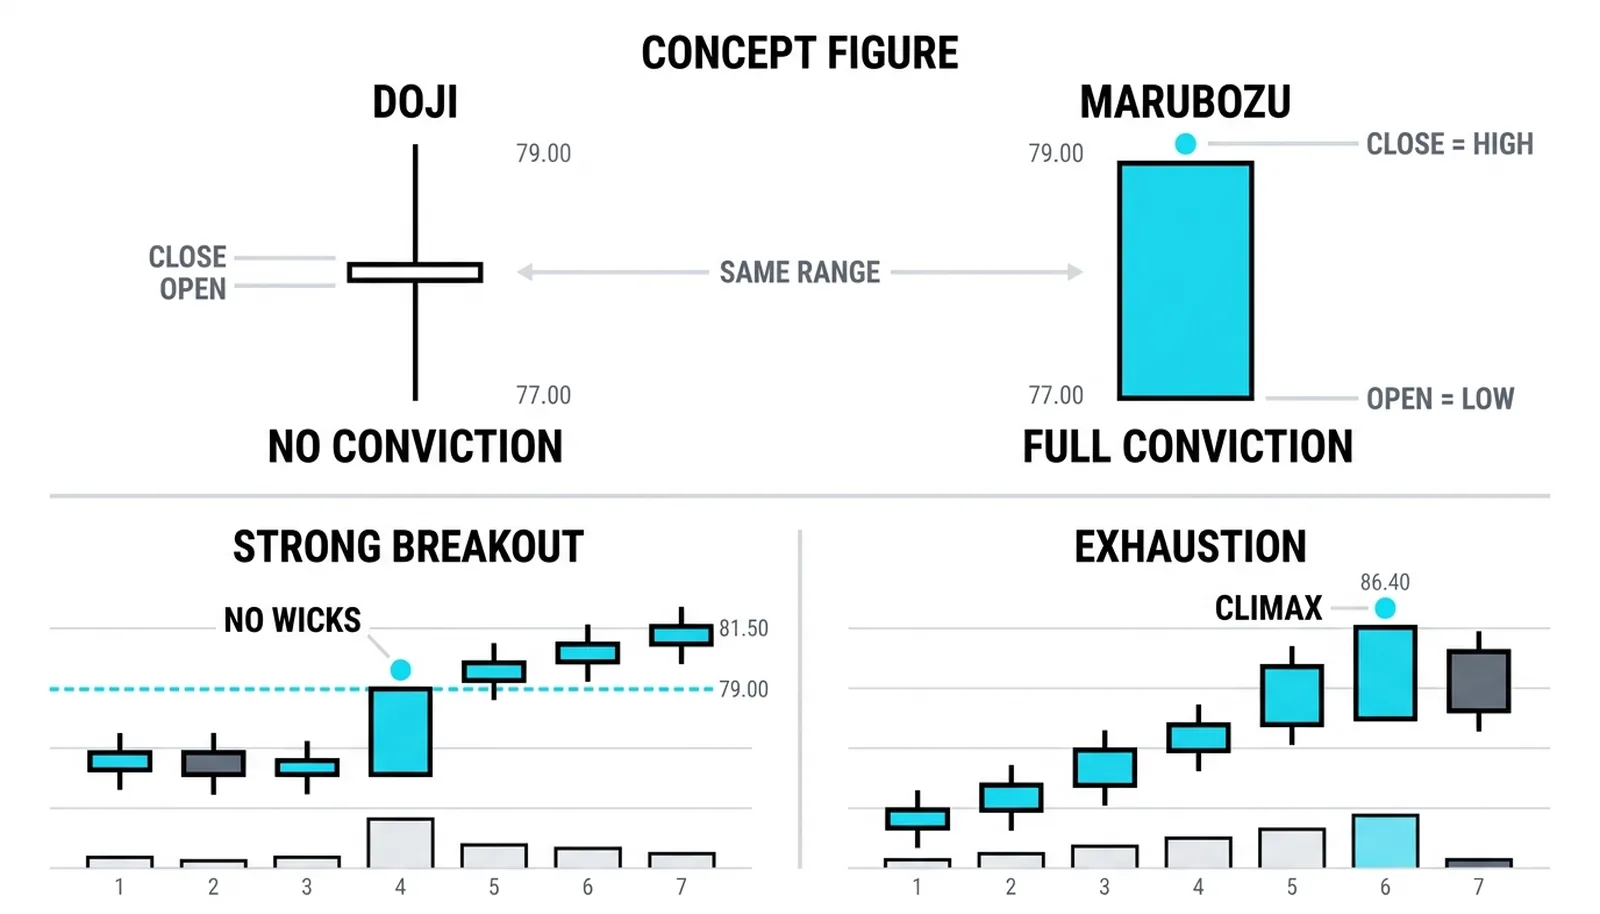
Context decides what that control means. Two readings matter most:
- A breakout bar with no wicks is a strong breakout. Price was stuck under a level, then one candle drove through it and closed at the high. The conviction confirms the break.
- A marubozu at the end of a long run is a climax. After an extended move, a final burst of urgency often marks exhaustion, not fresh strength. The last buyers just arrived.
Same shape, opposite implications. The candle measures pressure. It does not tell you which part of the story you are in. That part comes from structure, trend, and location, the skills from the earlier levels.
Now the honesty. Quantitative pattern research back-tested the pattern across nine assets on hourly data and found hit ratios clustered near fifty percent with profit factors barely above one. The conclusion from quantitative pattern research: the pattern is unlikely to deliver a profitable strategy on its own. Treat that as the baseline. The candle is evidence about pressure, not a signal to trade alone.
Trading It Without a Tail to Hide Behind
In an established trend, a marubozu is a continuation tell. The standard entry takes the next bar's open, or the break of the candle's extreme if you want confirmation that momentum carried into the next session.
The stop has a problem the wickier candles do not. There is no tail to hide behind. On a hammer or a rejection bar, the wick tip gives you a natural line where the trade idea is proven wrong. On a marubozu, the body edge is the only structure, and the body edge is the entire candle.
Two workable solutions exist:
- Stop beyond the candle's far end plus a buffer. On a bullish marubozu, that means below the open, with enough room that ordinary noise does not tag you out. The risk per trade gets large because the candle itself is large.
- Stop below the breakout base instead. If the marubozu broke a level, the old consolidation floor is the real line. A close back inside the base kills the breakout story regardless of where the candle's open sits.
Position sizing absorbs the difference. A wide stop is not a reason to skip the trade. It is a reason to cut the size so the same fixed amount of money is at risk. The candle being big is the signal, and the cost of that information is a wider invalidation line.
One more filter helps. Prefer marubozu candles that appear early in a move, at a break from a base or a pullback resumption. Pass on the ones that appear after price has already traveled a long way. Early conviction has room to run. Late conviction is often the crowd arriving at once.
The Whole Bar at 52.00
Everything below is hypothetical, with round numbers, to show the mechanics.
An uptrend consolidates just under 52.00 for several sessions. Then one session prints a bullish marubozu: open 51.20, high 52.00, low 51.20, close 52.00. A body of 0.80 with zero wicks, closing exactly at the resistance shelf.
The entry takes the next open at 52.05, paying a small premium for confirmation that buyers showed up again. The stop sits at 51.15, just below the breakout base, risking 0.90 per share. The target is the next resistance at 54.20, a gain of 2.15, about 2.4 times the risk.
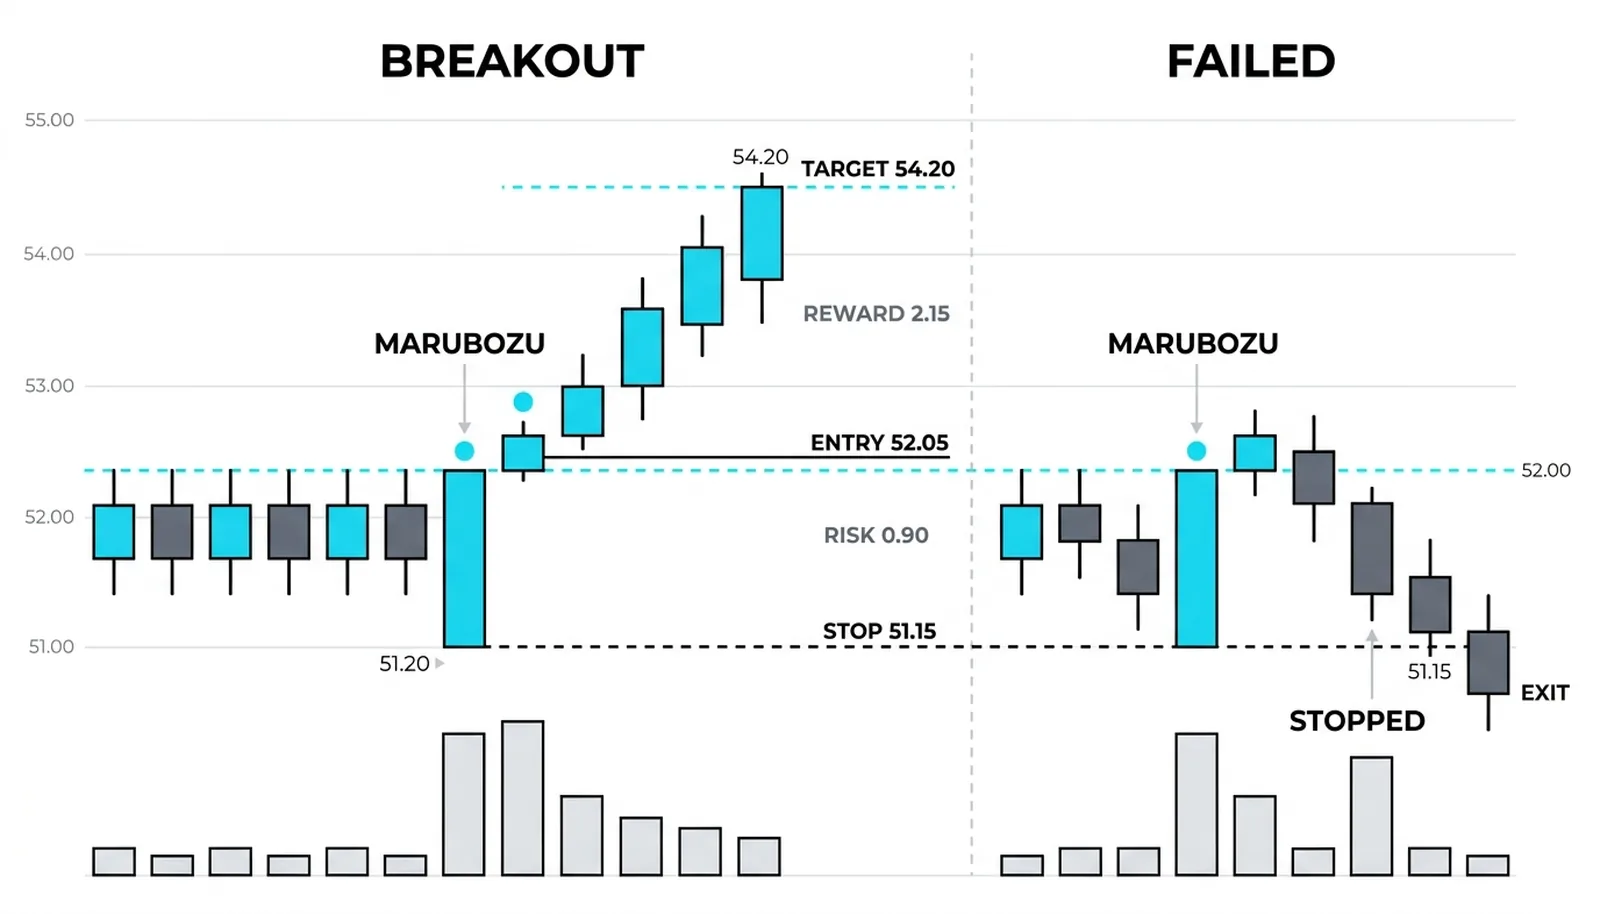
Note what the stop placement says. A dip back under 51.20 means the candle's open failed to hold, and a move through the base means the breakout itself failed. One line covers both.
The failed version matters just as much. Two sessions later, price closes back below 51.20. The conviction story is dead. The position exits near the stop without debate, because the entire reason for the trade was one-sided control, and one-sided control no longer exists. The loss is the planned 0.90, not a hope-driven hold.
| Candle feature | The requirement | What it tells | The common mistake |
|---|---|---|---|
| Body | Spans the full high-to-low range, or within roughly a tenth of it | One side controlled the whole period | Demanding exact decimal equality and never finding the pattern |
| Upper wick | Absent or a few ticks | No pullback after the high printed | Ignoring a tiny wick and discarding a valid signal |
| Lower wick | Absent or a few ticks | No pushback below the open | Reading it as strength without checking where in the trend it formed |
| Close | At the extreme of the range | Urgency into the final tick | Trading the shape alone, with no trend or level behind it |
Marubozu Questions, Answered
What is a marubozu candle?
A marubozu is a candlestick with no wicks, where the body covers the entire high-to-low range. Bullish versions open at the low and close at the high; bearish versions do the reverse. The name is Japanese for a shaved head, and the shape signals that one side controlled the full session.
Does a marubozu always mean the trend continues?
No. Back-tests across multiple assets show hit ratios near fifty percent when the candle is traded alone. In an established trend it leans toward continuation, but after a long run it can mark a climax instead. Context decides, not the shape.
Why are marubozu candles rare on daily charts?
Because a full day of trading almost always produces at least one pushback, and any pushback leaves a wick. Shorter time frames give the open and close less time to wander from the extremes, so clean prints show up far more often there.
Where does the stop go on a marubozu trade?
Either beyond the candle's far end with a buffer, or beyond the structure the candle broke out of. There is no wick to hide behind, so the stop is wider than on tailed candles, and position size should shrink to keep the money risk constant.
The next lesson stays on the single-candle level but flips the emphasis from body to wick: how to read a long shadow as a rejection message, and what the location of that rejection says about who just lost the fight.