The Fibonacci Sequence: the Math Behind It
The fibonacci sequence is the number series 0, 1, 1, 2, 3, 5, 8, 13, 21, 34, 55, 89, 144, in which every number after the first two is simply the sum of the two before it, and every Fibonacci tool on a trading chart descends from it. Retracements, extensions, projections, time zones: all of them trace back to this one string of additions. Before this level draws a single line on a chart, the math underneath needs to be understood on its own terms.

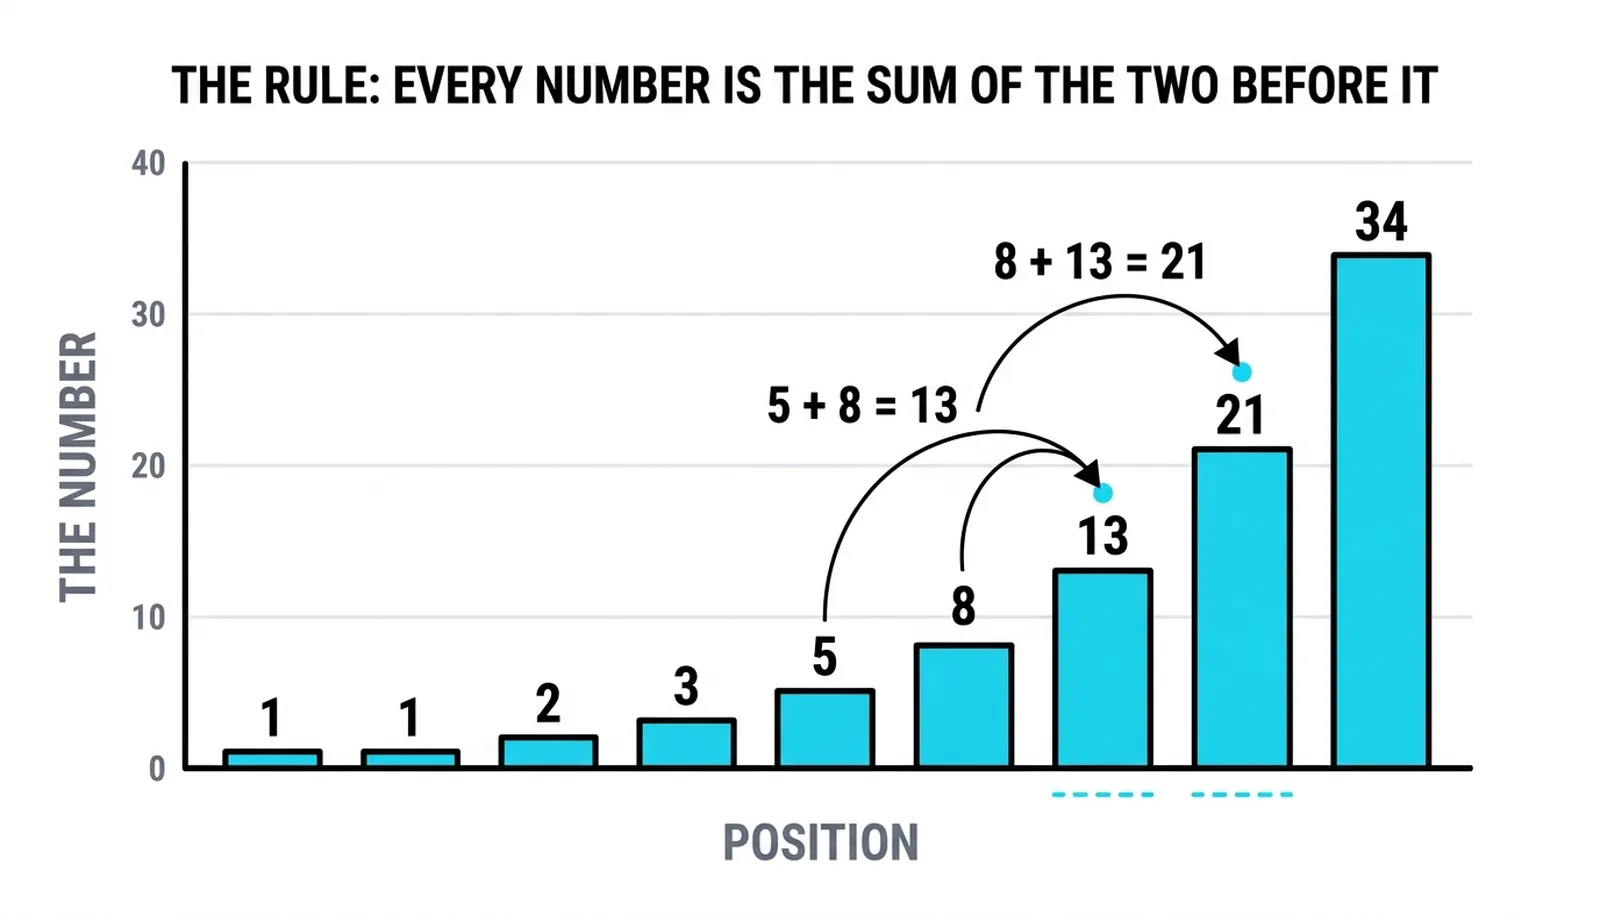
The origin story is a puzzle about rabbits. A pair is born, matures for a month, then produces a new pair every month from its second month on, and every new pair behaves the same way. The monthly counts run one, one, two, three, five, eight. The puzzle's answer became the sequence itself, and the sequence became the foundation of an entire family of trading tools.
The previous level taught how to read swings: their direction, their location, their state. This level measures them, and everything it measures descends from the series this lesson builds.
The Rule That Builds the Series
The sequence comes from Leonardo de Pisa, a merchant's son from Pisa later nicknamed Fibonacci. His 1202 book Liber Abaci introduced Hindu-Arabic numerals to European merchants and, along the way, posed the rabbit puzzle as an exercise. The book was a commercial arithmetic text, not a mystical document.
The rule could not be simpler. Start with 0 and 1. Derive every next number by adding the prior two: 0 + 1 = 1, 1 + 1 = 2, 1 + 2 = 3, 2 + 3 = 5, and onward without end. 55 + 89 = 144. 89 + 144 = 233. The series runs to infinity on one instruction repeated forever.
Fibonacci cluster practice, which this whole section leans on, states the rule exactly that way: the next number is derived by adding the prior two. No multiplication, no exponents, no special cases. One addition, repeated.
That simplicity matters. A rule this plain producing something useful is surprising, and the surprise is what the next section is about.
The Constant Hiding Inside
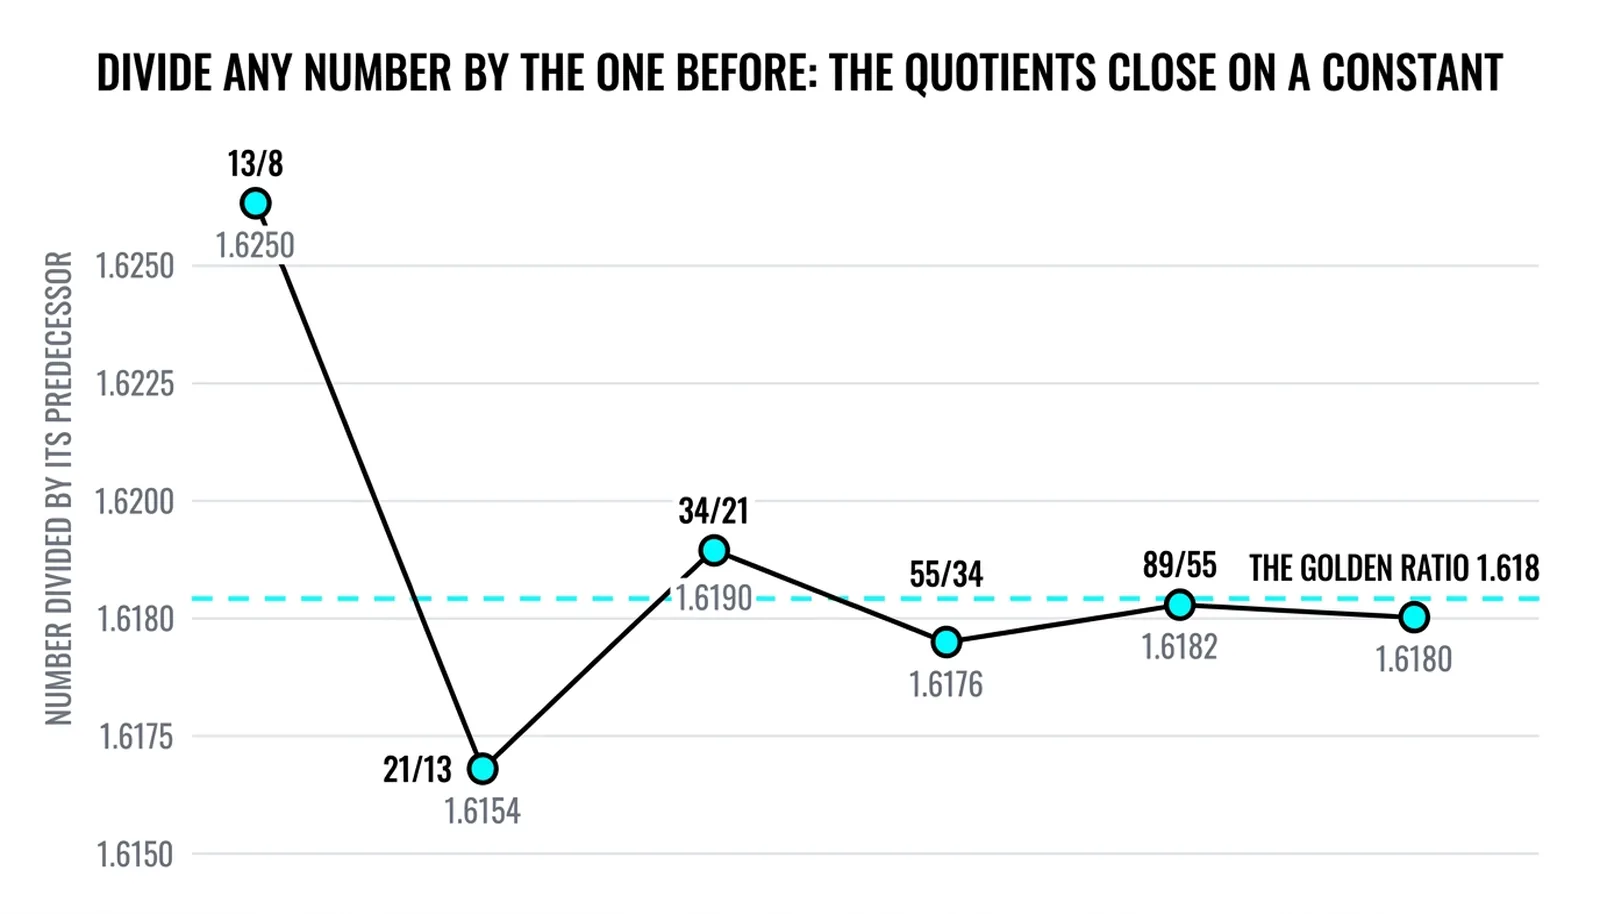
The fascination starts past the first few numbers. Divide any number in the series by its predecessor and watch what the quotient does. 34 divided by 21 is 1.6190. 55 divided by 34 is 1.6176. 89 divided by 55 is 1.6182. 144 divided by 89 is 1.6180. Each quotient lands closer to a single value: 1.618.
That constant carries three names. It is called the golden ratio, the golden mean, and the divine proportion. Mathematicians denote it with the Greek letter phi. It appears in geometry, in growth patterns, in proportions that recur across nature and art, which is exactly why so much mythology has been piled on top of it.
Strip the mythology away and one fact remains: the ratio is a genuine mathematical constant, provably embedded in the series. Nothing about that is invented. Nothing about it is mystical either. It is what repeated addition converges toward, the way repeated halving converges toward zero.
The inverse of 1.618 is 0.618, and from that inverse a whole family of ratios derives. Squaring 0.618 gives roughly 0.382. Cubing it gives roughly 0.236. Its square root gives roughly 0.786. These are one family, arithmetic transformations of a single constant, all related by construction.
That family, 0.236, 0.382, 0.618, 0.786, is what later lessons in this section will draw across price charts as retracement and extension levels. When a platform offers those percentages as default settings, the defaults are the constant wearing different clothes. The chart tool and the rabbit puzzle are the same idea at different distances.
What a Trader Inherits From It
Every ratio on every Fibonacci tool a platform ships descends from this series. Knowing the origin tells the trader something useful: the ratios are not arbitrary lines someone invented during a quiet week of charting. They are the only fixed proportions the series contains, derived by division and inversion from a single constant.
That inheritance is worth understanding for a practical reason. A trader who knows where 0.382 comes from treats it differently than a trader who memorized it as a magic number. The first trader knows it is one member of a related family and can judge when a level is meaningful structure and when it is noise. The second trader has a superstition with decimal places.
Now the honesty, stated plainly. The sequence is mathematics, and nothing in it knows about price. The rabbits forecast nothing. The series does not contain markets, participants, fear, or flow. Any claim that the arithmetic alone predicts a tick is a claim the math itself does not support.
The trading claims begin at the ratio and at human behavior, not at the series itself. Enough participants watch the same derived levels that those levels can attract orders, pauses, and reactions, and later lessons will examine that behavior carefully. This lesson establishes the origin honestly so those lessons can use the derived ratios without pretending the addition rule does the predicting.
Think of it this way: the sequence is the raw material, the ratios are the refined product, and the chart behavior is a separate question entirely. Confusing the three is how Fibonacci gets a reputation it does not deserve, both too good and too bad.
From 1 to 144 in Eleven Steps
Here is the mechanism worked out with round numbers, purely arithmetic, nothing about markets. Start with 1 and 1, then apply the single rule eleven times.
- 1 + 1 = 2
- 1 + 2 = 3
- 2 + 3 = 5
- 3 + 5 = 8
- 5 + 8 = 13
- 8 + 13 = 21
- 13 + 21 = 34
- 21 + 34 = 55
- 34 + 55 = 89
- 55 + 89 = 144
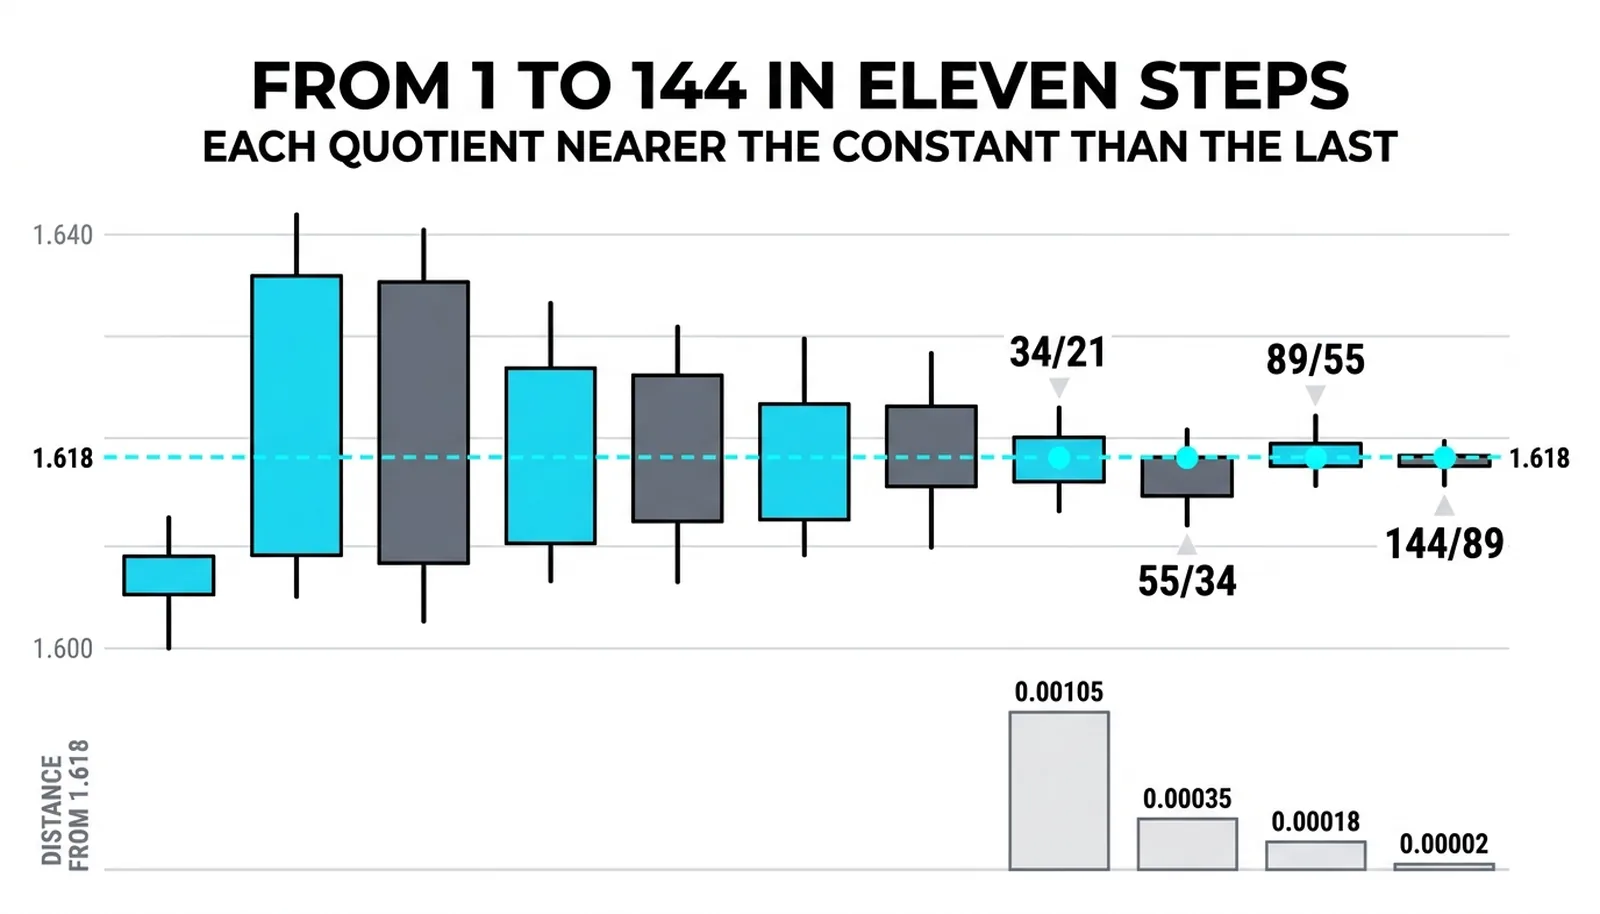
Every step is a sum. Nothing else happens. Now divide each of the last four numbers by its predecessor and watch the quotients close in on the constant.
| Pair divided | Quotient | Distance from 1.618 | What it shows |
|---|---|---|---|
| 34 / 21 | 1.6190 | 0.0010 | Already close, still slightly high |
| 55 / 34 | 1.6176 | 0.0004 | Nearer, now slightly low |
| 89 / 55 | 1.6182 | 0.0002 | Closer still, slightly high |
| 144 / 89 | 1.6180 | 0.0000 | Effectively on the constant |
The read is simple. The quotients alternate just above and just below 1.618, and each one lands nearer than the last. The convergence is the entire phenomenon: a fixed proportion hiding inside a counting rule, emerging on its own after enough repetitions.
Nothing was tuned. Nothing was fitted. The constant was in the rule from the first addition, and the worked example just makes it visible.
Fibonacci Sequence Questions, Answered
What is the fibonacci sequence?
It is the series 0, 1, 1, 2, 3, 5, 8, 13, 21, 34, 55, 89, 144, and so on, where every number after the first two is the sum of the two before it. One addition rule, repeated forever, generates the whole series.
Where did the fibonacci sequence come from?
It comes from Leonardo de Pisa, later nicknamed Fibonacci, whose 1202 book Liber Abaci posed a puzzle about breeding rabbits. The monthly pair counts in that puzzle, one, one, two, three, five, eight, formed the series that now carries the name.
Why does the fibonacci sequence matter in trading?
Because every ratio on every Fibonacci chart tool descends from it. Dividing series numbers by their predecessors converges on 1.618, and inverting and transforming that constant produces the 0.236, 0.382, 0.618, and 0.786 levels that later lessons will apply to price swings. The sequence itself predicts nothing; the derived ratios are what traders actually use.
What number comes after 144 in the sequence?
233, from adding 89 and 144. The next after that is 377, then 610, and the series continues without limit under the same rule.
With the series and its constant now established, the next lesson puts the golden ratio itself under the light: what 1.618 actually is, where it legitimately appears, and which claims about it deserve a raised eyebrow before any of it touches a chart.