Keltner Channels, Explained
Keltner Channels wrap a moving average between two bands the way Bollinger Bands do, and the difference between the two tools teaches you more about volatility than either alone. The Keltner engine measures how far price travels bar by bar, average true range, while the Bollinger engine measures how scattered the closes are, standard deviation. Same chart, two different questions about volatility.

A fence that breathes: that is the working picture. The fence posts stand at the average, and the rails flex with the pace of travel. A market ambling quietly keeps the rails close. A market sprinting pushes them out until the new pace becomes the reference. The rails respond to how fast price is moving, and nothing else.
The construction basics live in the Bollinger Bands breakdown, and the tool belongs to the same volatility family of the four indicator categories; this lesson owns the Keltner side of the comparison.
The Construction: Two Recipes
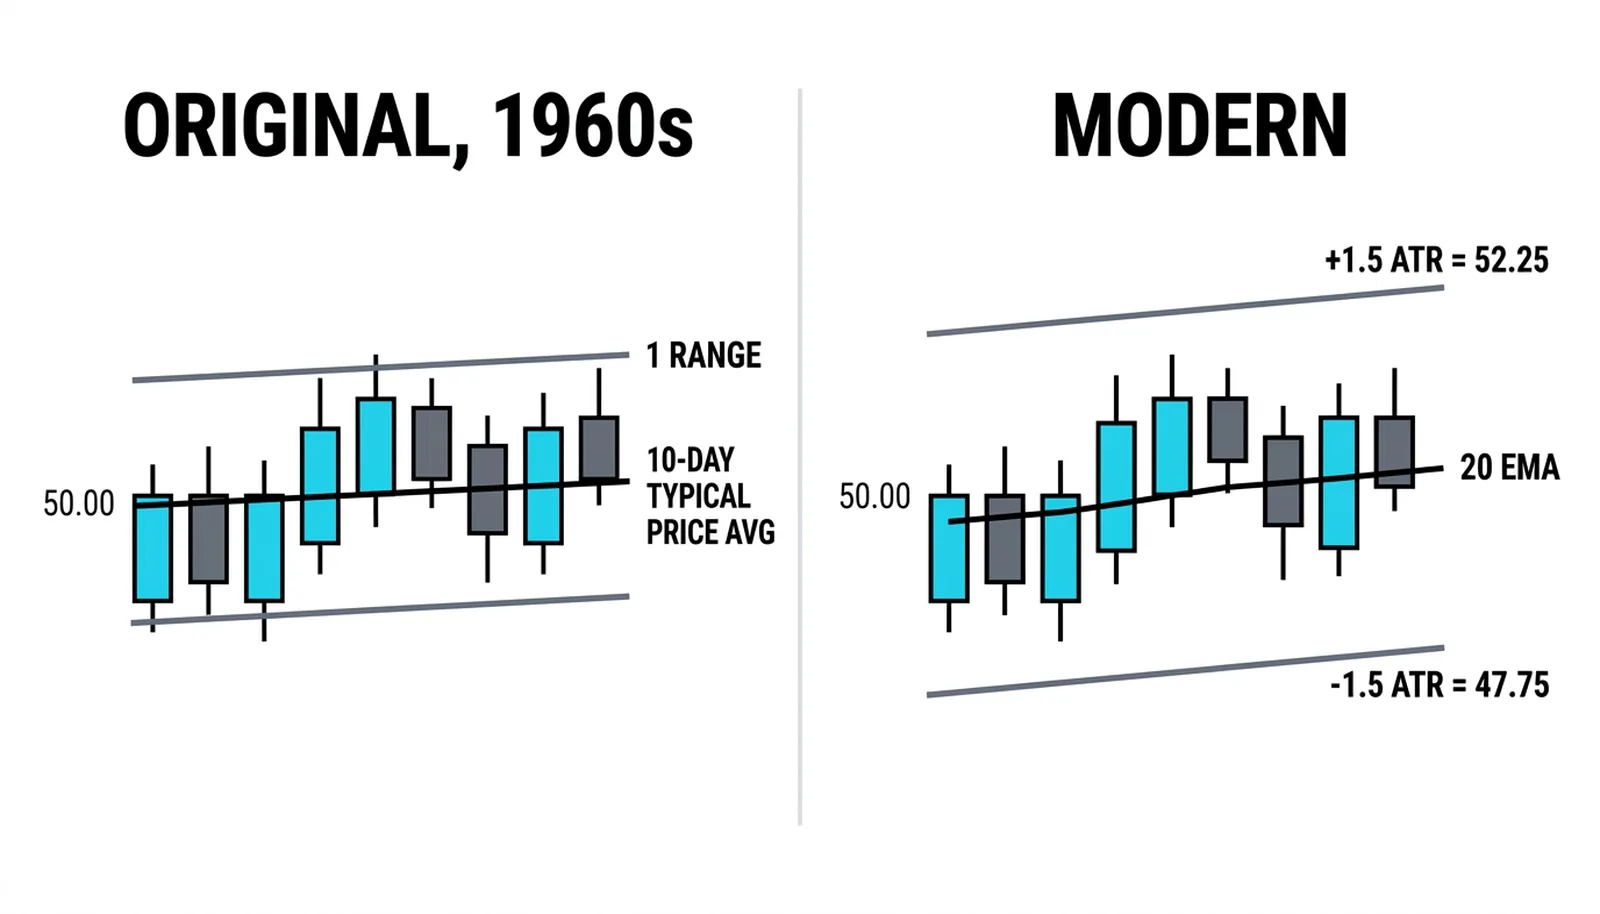
The original recipe came from Chester Keltner in the 1960s. Take the ten-day simple moving average of the typical price, the high plus low plus close divided by three. That is the centerline. Then take the ten-day moving average of the daily high-low range, and place the bands one such range above and below the centerline. An envelope built from the market's own typical travel distance.
The modern recipe replaced every part of that and won everywhere. The centerline is a 20-period exponential moving average. The bands sit at 1.5 times the 14 or 20-period average true range above and below it. The revised version is the one every major platform ships, and it is the version used in the squeeze work covered in the Bollinger Band squeeze lesson, where the day trading framework defines the squeeze as the Bollinger Bands trading inside these channels. When this lesson says Keltner Channels from here on, it means the modern recipe.
What the ATR Engine Changes
True range counts the whole bar, gaps included, and the average of those true ranges is the unit of travel. The Keltner bands are that unit, multiplied out from a moving average. The practical consequence shows up in quiet phases: standard deviation collapses faster than true range, because a pinch kills scatter immediately while a market still travels, wicks and all. Put the two tools on one chart and the Bollinger Bands pull inside the Keltner Channels exactly when the market goes still.
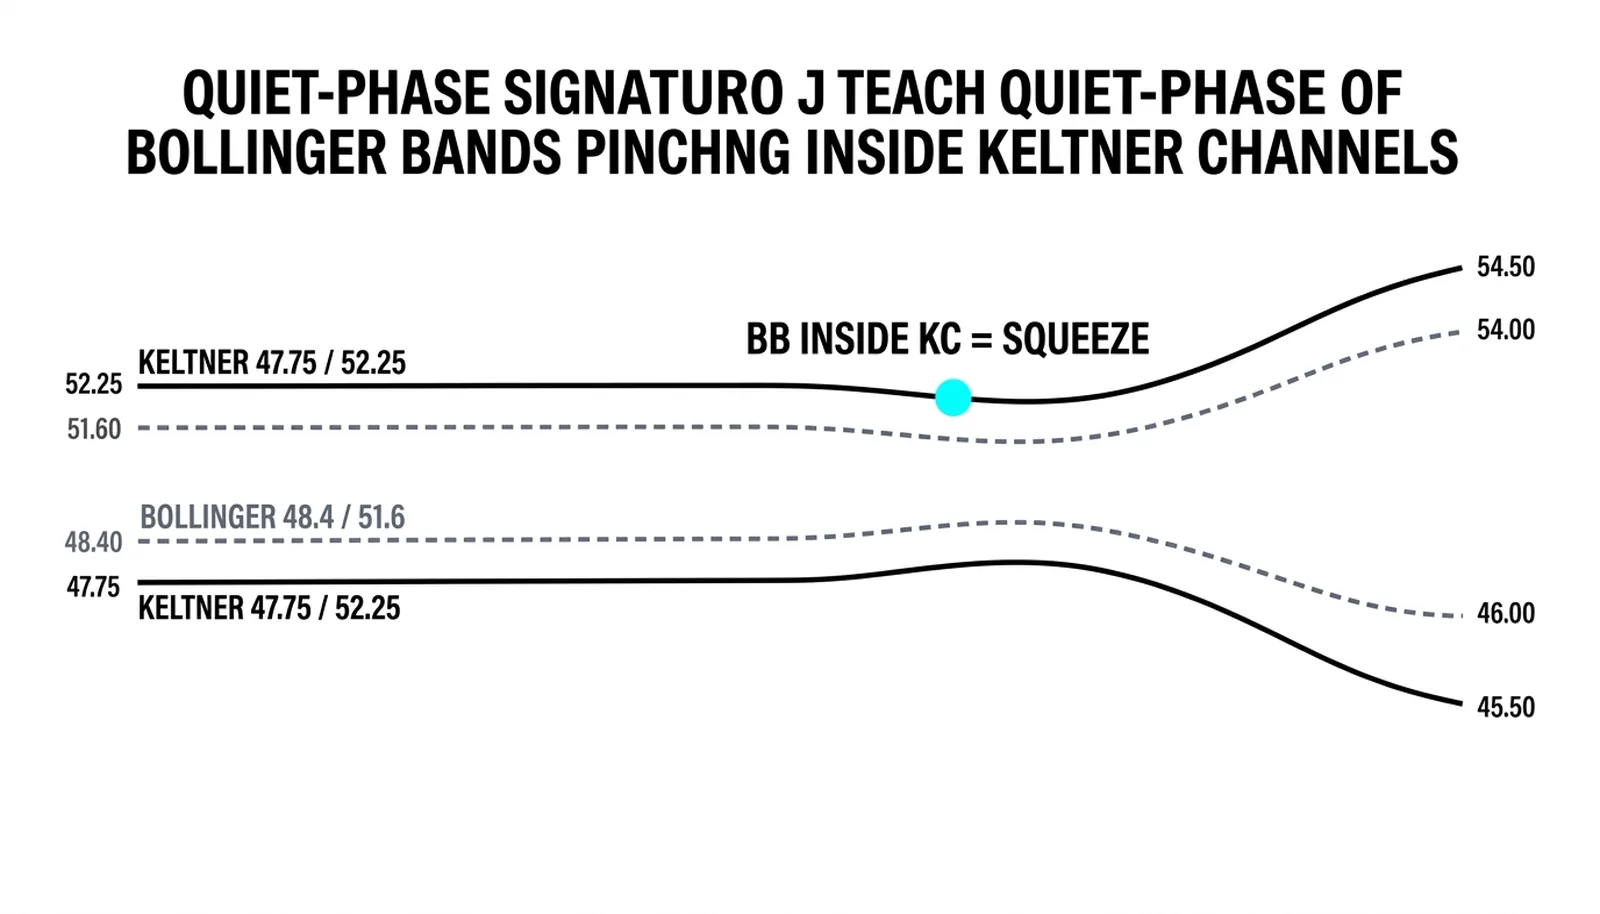
That overlap is not a curiosity; it is a definition. When the deviation bands sit inside the ATR bands, scatter has fallen below the pace of travel, which is the modern squeeze test. The Keltner Channels act as the ruler the squeeze is measured against, and the full trading treatment lives in the squeeze lesson rather than here.
Reading the Channel
The channel's centerline is an exponential moving average, so everything the moving-average lessons taught about slope and dynamic support applies to it. A tilted channel with price riding the upper band is a trend regime; the channel tilts because the average is climbing, and the band width reflects the trend's travel cost. Price repeatedly testing the upper band while the slope holds is continuation evidence, the same band-walking read from the breakout lesson, with an ATR engine underneath instead of deviations.
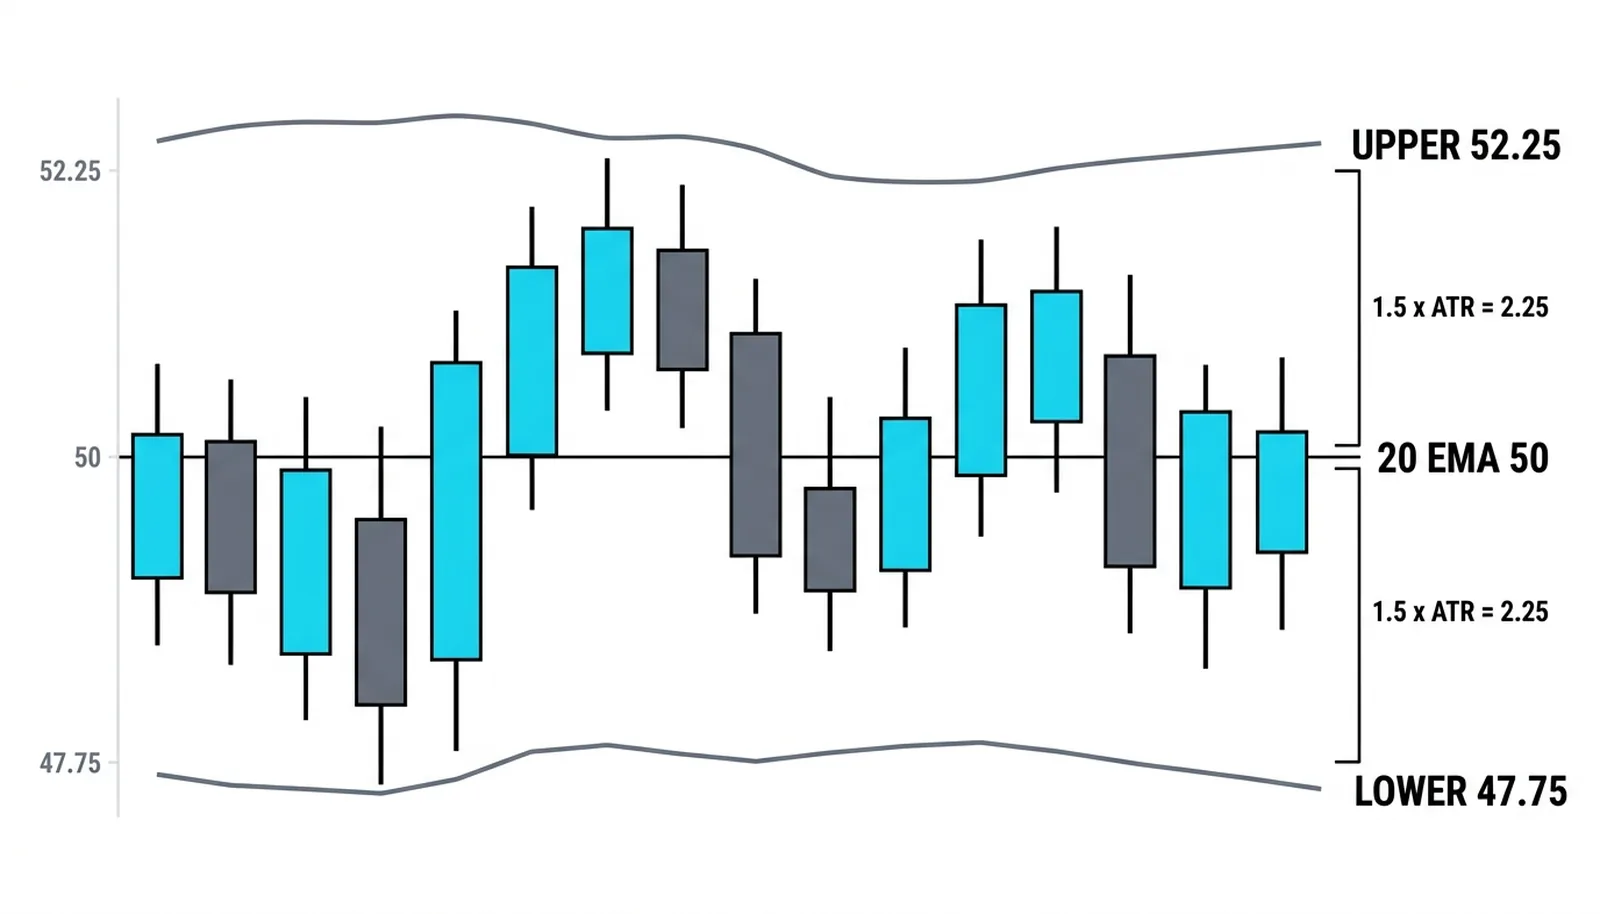
A flat channel with price ping-ponging between the bands is a range regime, and the bands themselves then behave like a box: touches matter less than the middle. The blunt line: the channel describes the market's current pace, it does not decide direction. Direction comes from the slope, from price behavior, and from the trend filters already covered in this level.
On settings: the 20 and 1.5 defaults are where nearly everyone lives, and changing them trades sensitivity against stability in the usual way. A shorter ATR makes the channel twitch with every burst; a longer one turns the channel into a slow regime map. Whatever you choose, remember the band distance is a multiple, so doubling the multiplier widens the channel by exactly as much as the market's own turbulence doubling would.
One Channel Pair, Computed
Round numbers, all hypothetical. A market trades near 50. Its 20-period exponential average sits at 50, and its 20-period average true range is 1.5. The Keltner bands sit at 50 plus and minus 1.5 times 1.5, which is 47.75 and 52.25.
Same market, same window: the 20-period standard deviation of closes is 0.8, so the Bollinger Bands sit at 48.4 and 51.6. Narrower than the Keltner pair, because the closes have clustered while the bars still travel. That is the quiet-phase signature.
A storm arrives. Average true range triples to 3, so the Keltner bands widen to 45.5 and 54.5. Standard deviation rises to 2, putting the Bollinger Bands at 46 and 54. Both tools widened; the ATR pair reacted to the pace and the deviation pair to the scatter, and the numbers stay close because a storm raises both at once. The differences live at the transitions, which is exactly where the squeeze measurement operates.
| Channel state | What it says | The regime read |
|---|---|---|
| Bollinger bands pinch inside the Keltner band | Scatter below pace of travel; extreme quiet | Squeeze condition; watchlist, per the squeeze lesson |
| Both pairs wide and expanding | Storm regime; pace and scatter rising together | Trend or event in progress; trade the direction, not the width |
| Keltner flat, price ping-ponging inside | Range regime at a steady pace | Box behavior; touches matter less than the middle |
| Keltner tilted, price pinned to one band | Trend regime; the average is traveling | Continuation evidence while the slope holds |
Keltner Channels, Answered
What are Keltner Channels?
A volatility channel built from a moving average plus a multiple of average true range. The modern version uses a 20-period exponential average with bands at plus and minus 1.5 ATR, and it turns the market's own pace of travel into the band distance.
How do Keltner Channels differ from Bollinger Bands?
The engine. Keltner bands flex with average true range, which measures travel including gaps and wicks; Bollinger bands flex with standard deviation, which measures how scattered closes are around their average. In quiet phases the deviation bands pinch inside the ATR bands, and that overlap is the basis of the modern squeeze test.
What settings do Keltner Channels use?
The platform default is 20 periods for the exponential average and 1.5 times a 14 or 20-period ATR. The historical original used a 10-day typical-price average with a 10-day high-low range envelope, which you may still find on old charts; the modern recipe replaced it in practice.
What does it mean when price rides the Keltner Channel?
In a tilted channel it is continuation evidence: the trend is traveling at a pace that keeps price testing the band, and shallow pullbacks toward the centerline confirm the slope. A ride along a flat channel is different, it is a range touching its walls, and the middle of a flat channel matters more than its edges.