ATR: The Average True Range, Explained
ATR, the average true range, measures how far a market typically travels per bar, gaps and all, and hands you that distance as a single number. It answers the question every other indicator dodges: how much room does this market need? Not where price is going, not whether the trend is strong, just the size of one ordinary bar.

A tide gauge does this for water. It reads the recent turbulence level wherever you moor it, in plain units, and updates as conditions change. The gauge never guesses the next storm; it tells you what the water is currently doing, so a boat can be rigged for the sea that exists rather than the sea you hoped for.
Volatility as a concept got its own treatment in the volatility lesson, and ATR is the indicator member of the same volatility family this level is working through.
The True Range: The Gap Counts
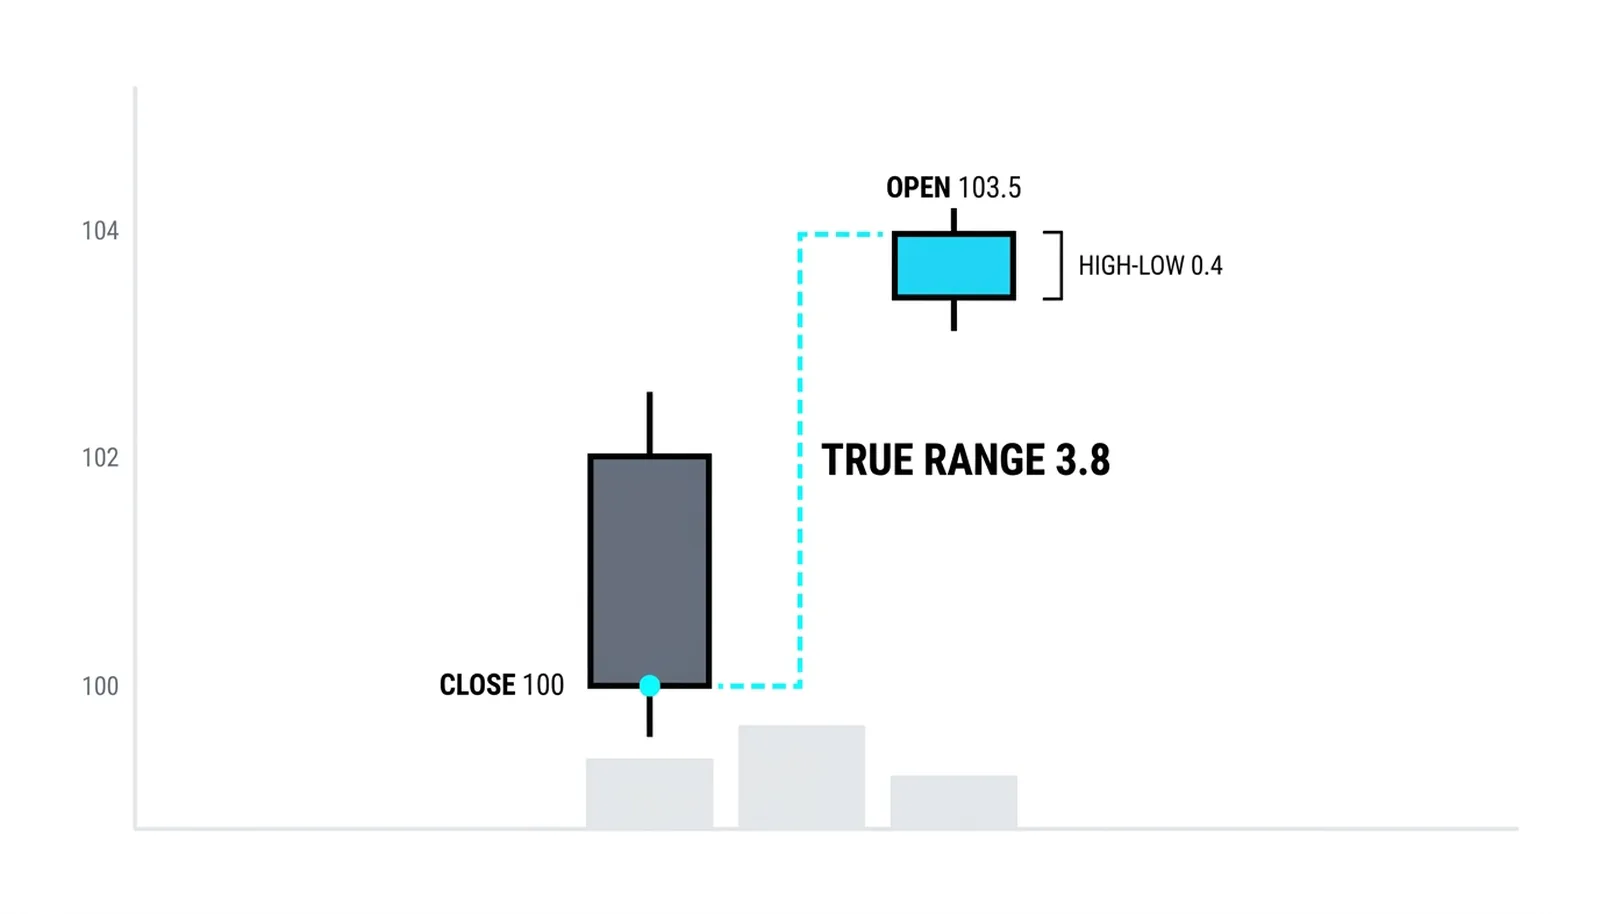
The building block is the true range, and the definition has one detail that matters more than everything else: the gap counts. The true range of a bar is the largest of three distances, the high minus the low, the high minus the previous close, and the previous close minus the low. Taking the largest of the three means an overnight gap gets counted as travel even though no trading happened inside it.
Why it matters: a stock closes at 100, and overnight news gaps it to 103.5. The next bar opens 103.5, trades between 103.4 and 103.8, closes 103.55. The high-low range of that bar is 0.4, a tiny quiet bar. The true range is 3.8, because the market genuinely moved 3.8 points between the previous close and the current high. Any volatility measure that ignores the gap would call the most eventful session of the month a snooze.
The Average: Smoothing the Storm
One true range is a reading; the indicator is the average of the last 14 of them, the default J. The original ATR/RSI framework published this tool alongside several others this level has already covered. Fourteen bars smooths the single-bar spikes into a stable turbulence level.
One platform warning belongs here. Smoothing conventions differ: some platforms use the indicator's original smoothing method, some use a simple moving average of the true ranges, and the two give different values on the same chart. An ATR of 2.4 on one platform can be 2.2 on another without anyone being wrong. Before comparing readings against anything written down, check which convention your chart uses.
What ATR Is For
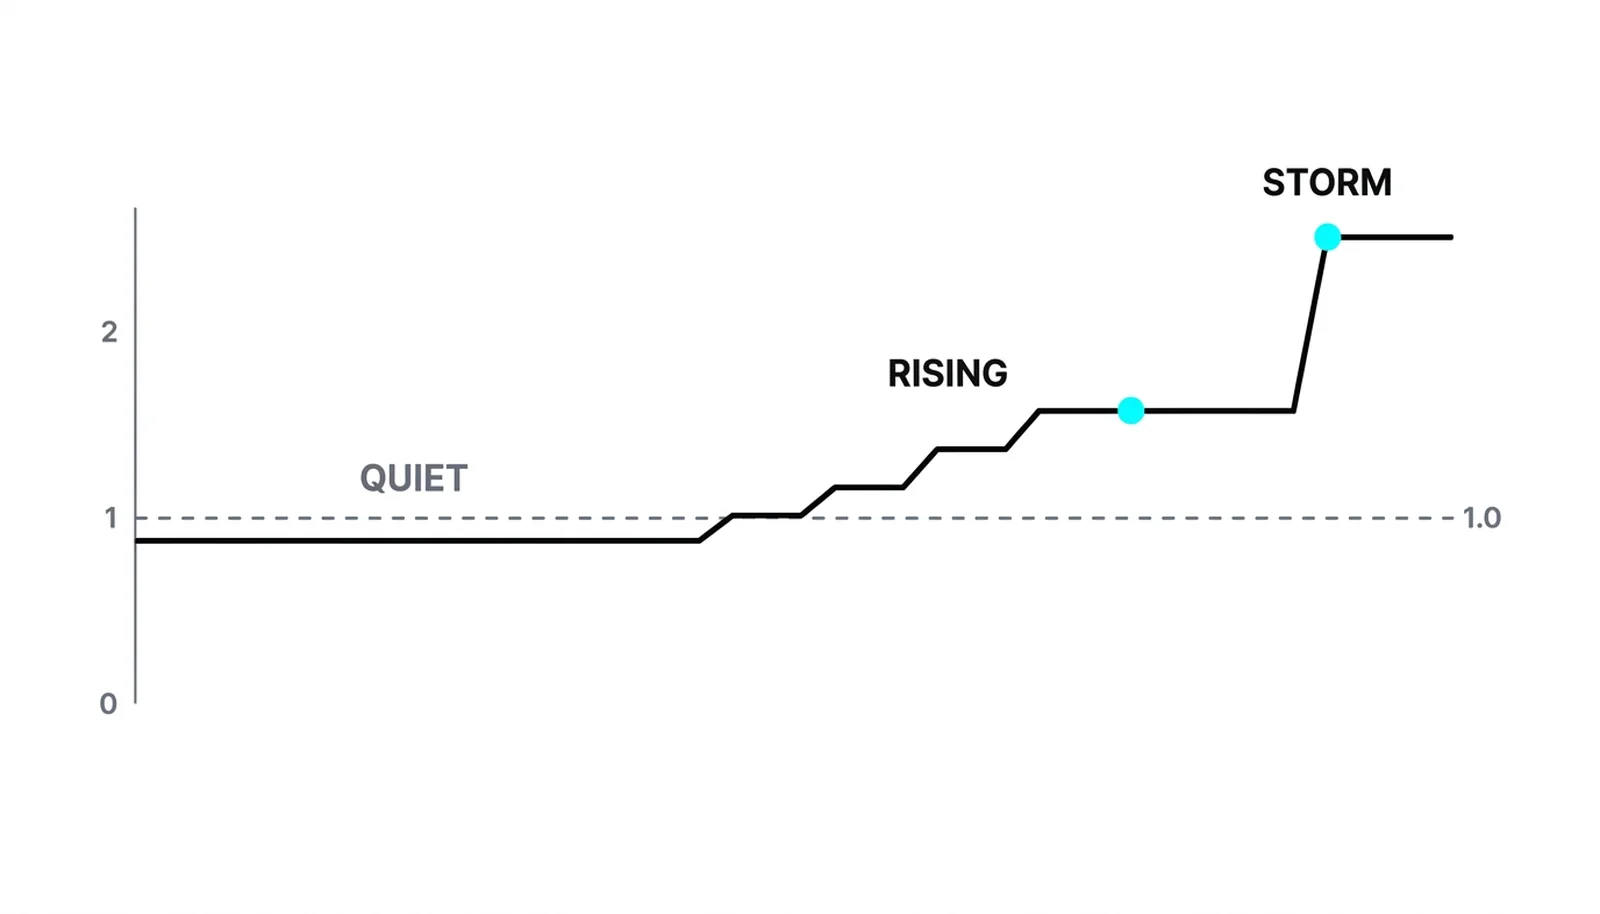
ATR is a regime dial. Low and falling means the market is quiet; rising means turbulence is arriving; extreme highs mark storms. Because volatility clusters, quiet stretches persist and stormy stretches persist, which is why the dial is honest: a market at its lowest ATR in months tends to stay quiet for a while, and that persistence is exactly what the squeeze logic in the Bollinger lessons exploits. ATR and BandWidth measure the same regime from two engines, and the Keltner Channels lesson shows how the two relate.
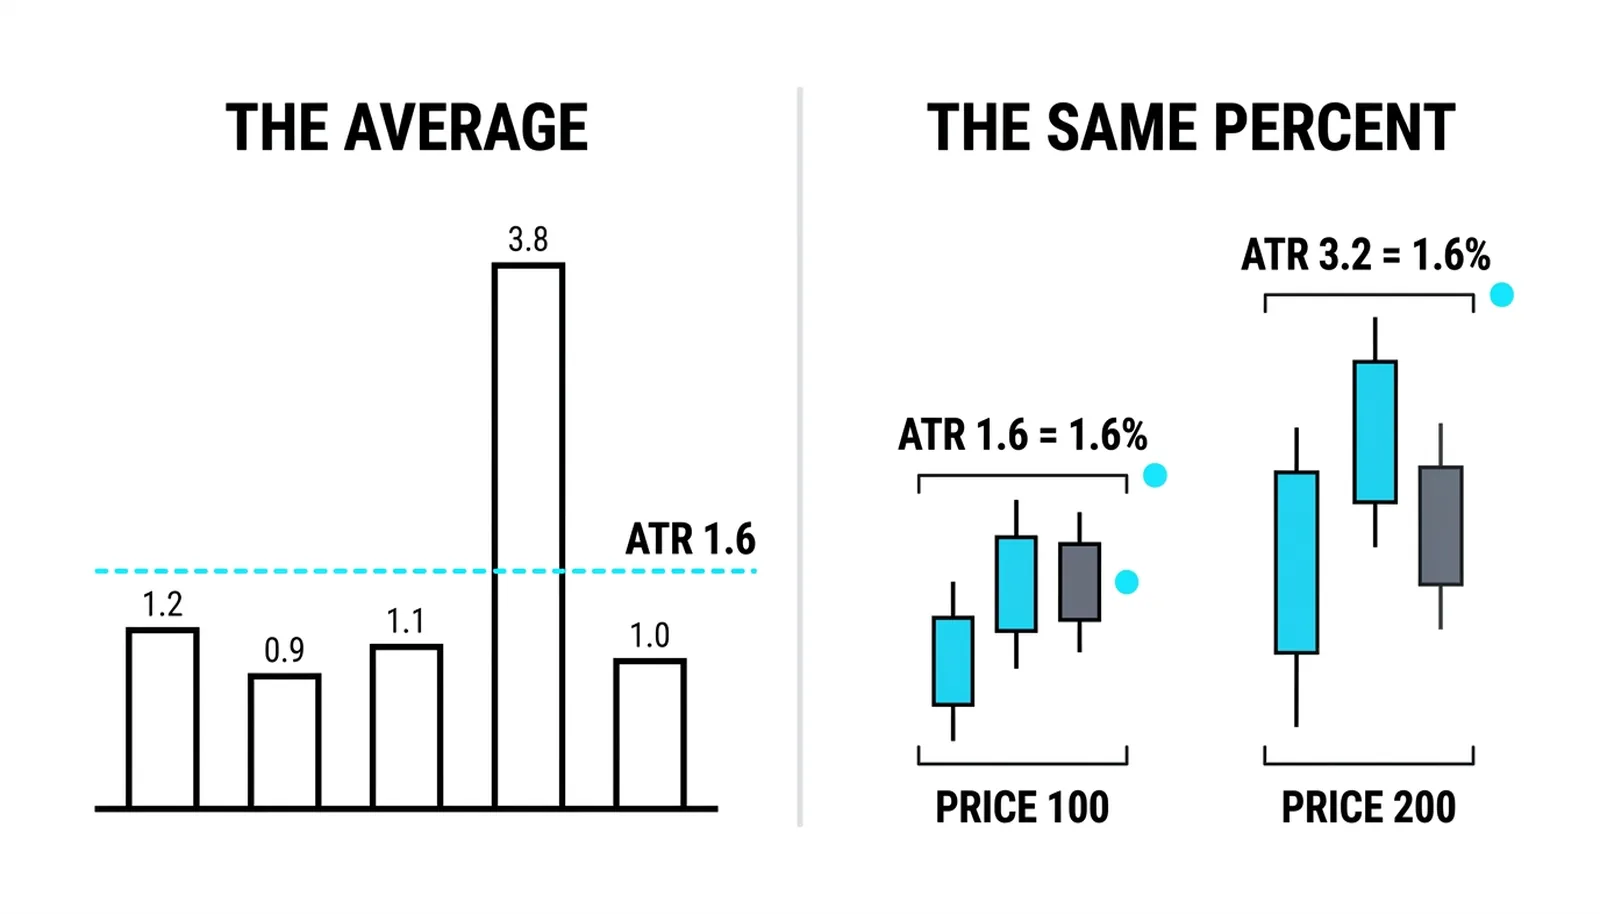
The dial has two hard limits. It carries no direction: rising ATR fits a crash and a melt-up equally. And it is price-scale dependent: an ATR of 2 on a 20-dollar market is enormous, 1 percent of price per bar, while an ATR of 2 on a 200-dollar market is dead calm, 1 percent becomes 0.1 percent. The fix is one division, ATR divided by price, which turns the number into a percent and lets a 20-dollar chart and a 200-dollar chart compare honestly. The same normalization logic the momentum lessons went through, points versus percent, applies here.
Traders also read ATR extremes as extremes of a cycle. The day trading framework treats a stretched ATR on the daily chart as exhaustion territory, a market traveling too far per bar to sustain, and looks for reversion once the storm peaks. SuperTrend, covered earlier in this level, is a different consumer of the same number: an ATR band flipped into a trend system. One measurement, many households.
One ATR, Computed
Round numbers, all hypothetical. A market closes five sessions with true ranges of 1.2, 0.9, 1.1, 3.8 and 1.0. The 3.8 was the gap session from earlier. The 5-period ATR is the average, 8.0 over 5, which is 1.6.
Read it twice. First against its own history: the last month of true ranges ran near 1.0, so 1.6 says turbulence has arrived and is being averaged in, one gap session lifted the whole reading by half. Second against price: at 100, an ATR of 1.6 is 1.6 percent per bar, a lively market. The same computation on a 200-dollar market behaving identically produces an ATR of 3.2 and the same 1.6 percent, which is the point of the normalization.
| ATR state | What it says about the regime | The practical response |
|---|---|---|
| At lows for the period | Quiet stretch, likely to persist by clustering | Expect small bars; widen patience for breakouts, see the squeeze logic |
| Rising off lows | Turbulence arriving; expansion under way | Size positions down; bars are getting more expensive to hold |
| Mid-range | Ordinary travel, no information | Standard settings apply |
| At extremes | Storm; possibly exhaustion of the storm | Widest stops or no trades; day trading practice reads these as reversion territory |
ATR, Answered
What does ATR tell you?
How far the market typically travels per bar over the last 14, gaps included. It is a volatility ruler: quiet, lively, or storm, in price units. It says nothing about direction and nothing about whether the level will persist, though volatility's clustering habit makes persistence the reasonable default.
Why does the true range include gaps?
Because a gap is real travel. A bar that opens 3 percent above the prior close and drifts sideways moved 3 percent from the last known price, and any range measure that skipped the gap would understate the session. Taking the largest of the three distances, bar range, high minus previous close, previous close minus low, captures it automatically.
What period does ATR use?
Fourteen is the default from the original ATR/RSI framework and remains standard. Shorter periods react faster and jump around more; longer ones smooth heavily. Also check the smoothing convention on your platform, the original smoothing versus a simple average, because the same market shows slightly different ATR values under the two.
How do I compare ATR across different markets?
Divide by price. ATR as a percent of price is comparable across a 20-dollar stock, a 2,000-dollar futures contract, and everything between, while the raw point reading only means something on the chart it came from. The percent form is also the honest way to notice that a 2-point ATR is huge on one market and invisible on another.