Correlations Between Markets
Correlations measure how much two markets move together, and they matter because three trades in three different instruments can secretly be one big bet on the same driver. You can hold positions across forex, commodities, and indices and still be exposed to a single headline. This lesson shows you how to see through the instrument labels to the bet underneath.

What Correlation Actually Is
Correlation describes the tendency of two markets to move in relation to each other. A positive correlation means they tend to move in the same direction. A negative correlation means they tend to move in opposite directions.
The scale runs from minus one to plus one. Plus one means the two move together almost perfectly. Minus one means they move opposite almost perfectly. Zero means there is no reliable link at all.
You do not need the math to use the idea. Think of markets as people at a party watching the same television: when the score changes, whole rooms turn at once. Your job is to know which rooms are watching which screen.
Most real-world links sit somewhere in the middle of the scale. Two markets might move together often enough to matter, but loosely enough to surprise you. That looseness is where the danger lives, and we will come back to it.
Where the Links Come From
Markets correlate because they share a driver. Something underneath both of them pushes at the same time.
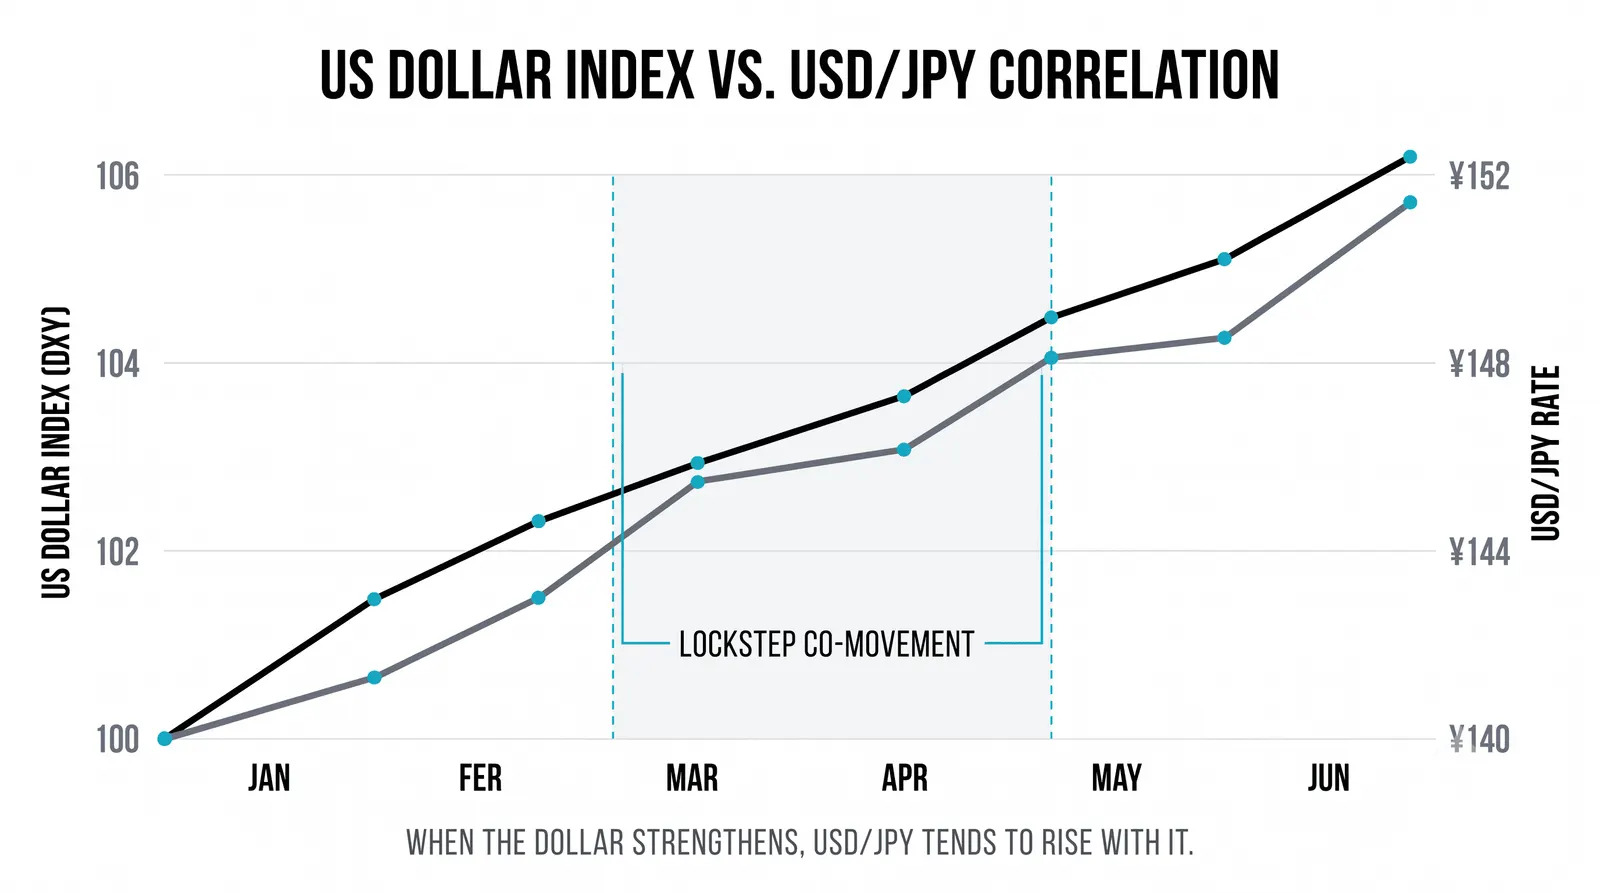
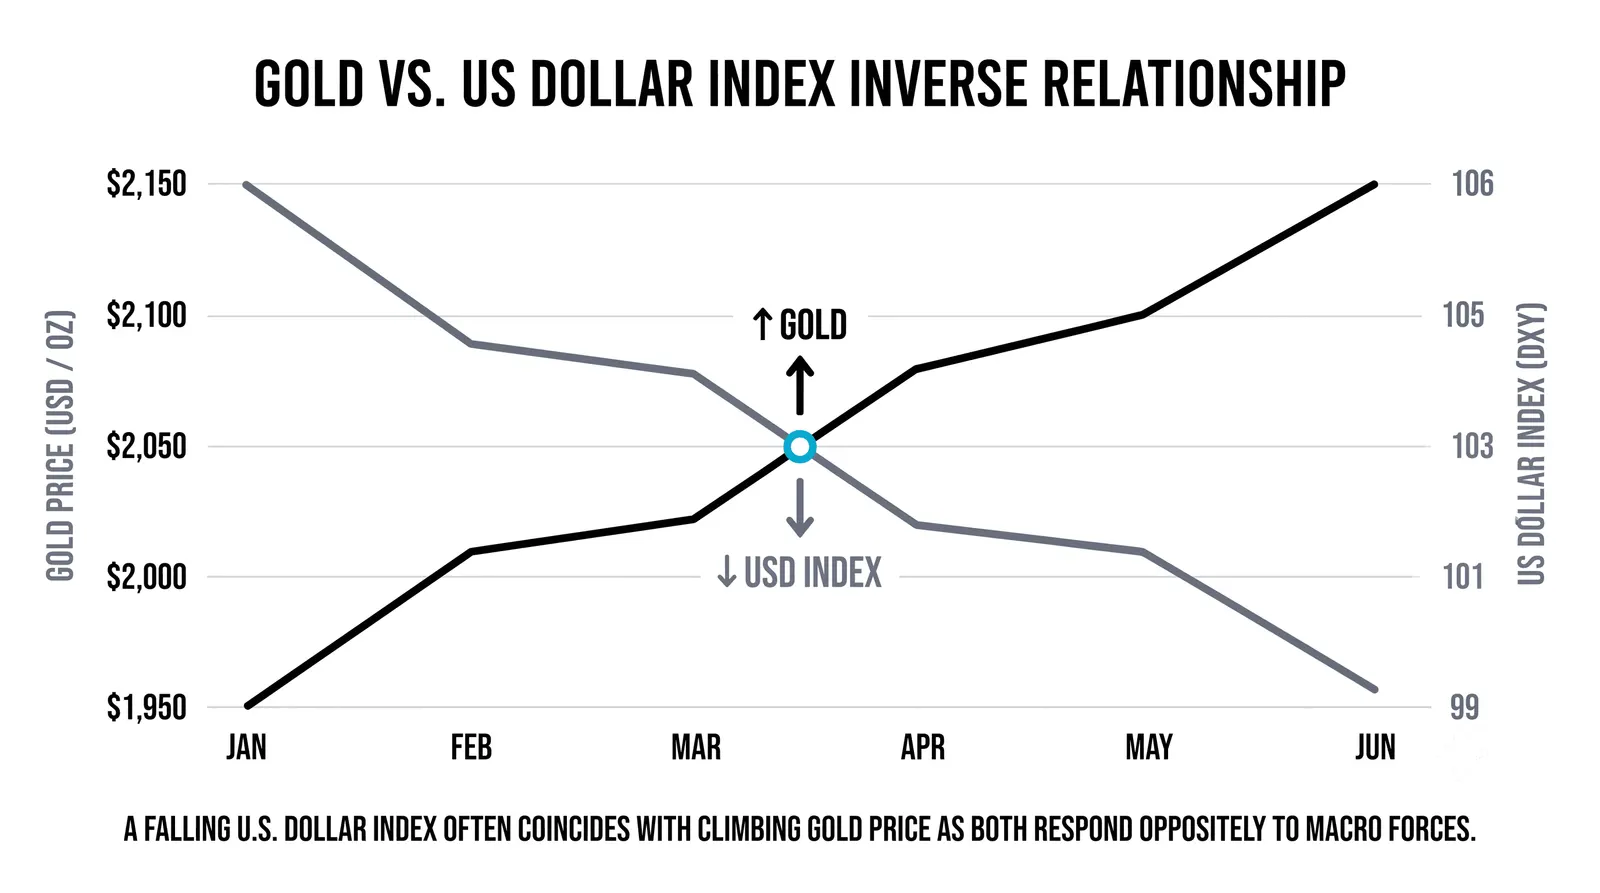
The US dollar is the clearest example. Dollar strength pulls most major currency pairs in a predictable direction and presses on dollar-priced commodities like gold and oil. When the dollar moves hard, a dozen charts move with it.
Interest rates work the same way. Rising rates tend to weigh on growth stocks, whose value depends on distant earnings, while bank stocks often benefit from wider lending margins. One driver, two opposite reactions.
Then there is the broadest driver of all: the global risk mood. When investors feel confident, money flows into stocks, riskier currencies, and crypto at the same time. When fear hits, it flows out of all of them at once. In a true risk-off episode, markets that normally ignore each other suddenly fall together.
Classic Relationships Worth Knowing
Some links show up often enough that every trader should have them on a mental checklist.
- The dollar and gold. Gold is priced in dollars, so a stronger dollar usually presses gold lower, and a weaker dollar tends to lift it.
- The dollar and major currency pairs. Any pair with the dollar in it is partly a bet on the dollar itself, so several pairs can move together when the dollar moves.
- Oil and energy shares. Higher oil prices tend to help oil producers' profits, so their shares often rise with the commodity.
- Oil and commodity currencies. Currencies of big oil exporters often strengthen when oil rises, because the country's export income rises with it.
- An index and its biggest components. A handful of giant companies can dominate an index, so the index and those names frequently move as one.
Treat these as tendencies, not rules. They describe what usually happens, not what must happen.
The Trap: Correlations Fool You
Correlations are habits, not laws. They describe how markets have behaved, and behavior changes.
Links drift as the regime changes. A relationship that held for years can weaken when central banks shift policy, when a war reroutes trade, or when a new driver takes over. The market does not send you a notice.
Worse, correlations break hardest in crises, exactly when you are counting on them. A hedge built on a reliable negative link can fail in the very panic it was bought for, because panics make everything move together.
Two markets that moved together for a year can decouple the week you bet on the link. That sentence deserves a second read.
The practical takeaway: never size a trade or a hedge on the assumption that a historical link will hold tomorrow. Use correlations as a map of what usually happens, and keep a plan for when the map is wrong.
A Worked Example: Three Trades, One Bet
Here is a hypothetical with round numbers. A trader with a $10,000 account opens three positions, each risking 1 percent, or $100.
- Long EUR/USD, risking $100.
- Long gold, risking $100.
- Short the dollar against a basket of currencies, risking $100.
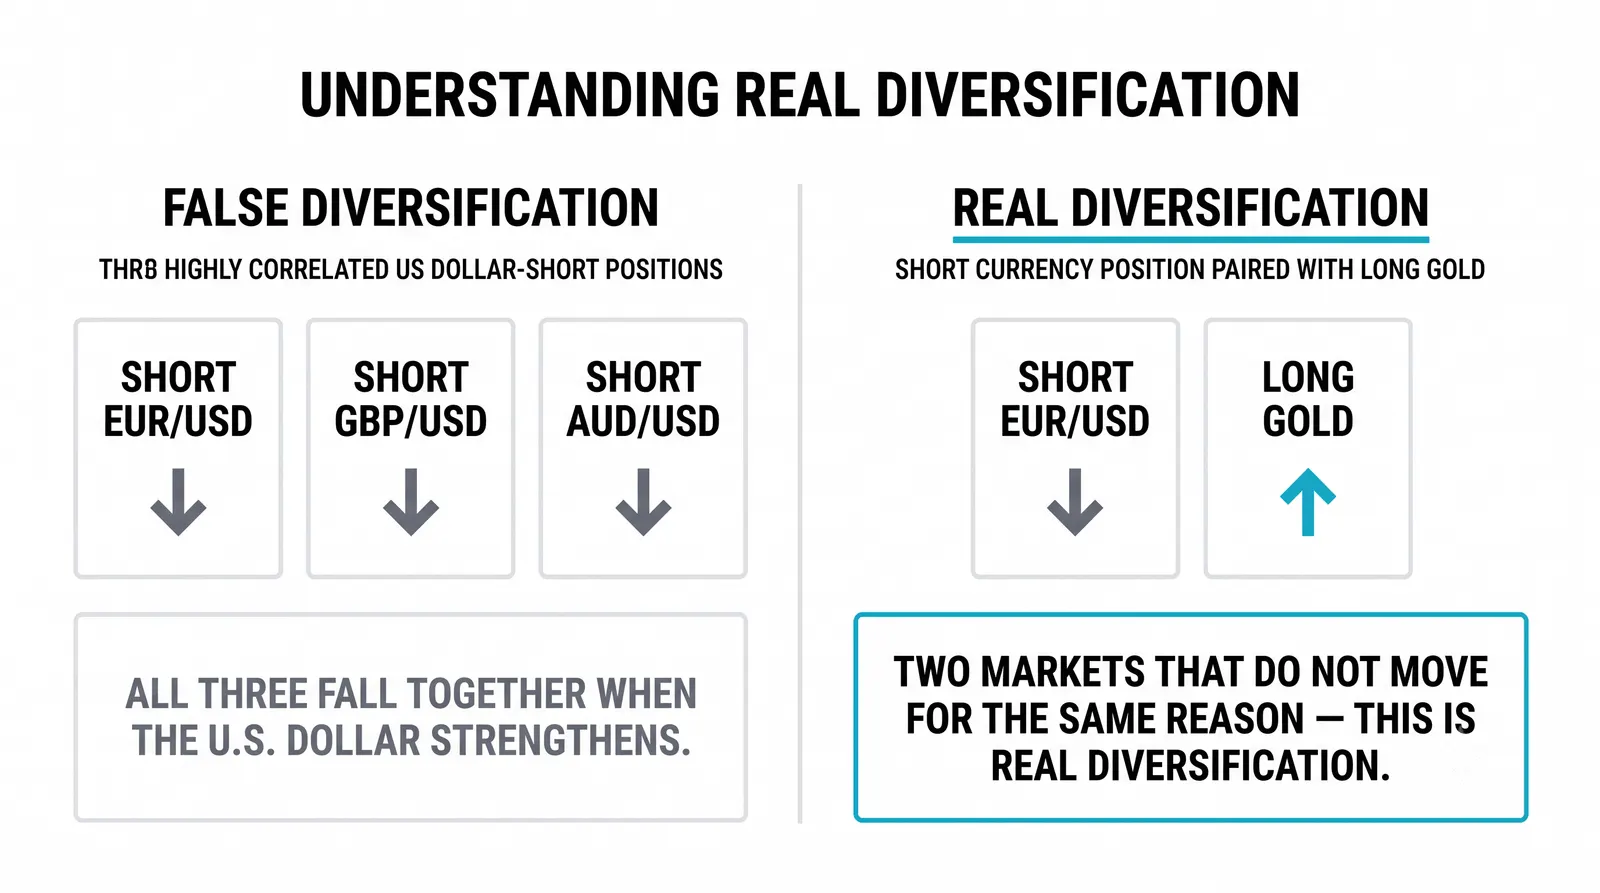
On paper, that looks like three separate, controlled risks across three different markets. It is not. All three positions answer the same question: will the dollar weaken?
Now a strong US inflation print lands. The dollar jumps. EUR/USD falls, gold falls, and the dollar basket trade falls, all in the same hour. The account takes close to 3 percent of damage, roughly $300, from what felt like three independent ideas.
The instruments were different. The bet was one. This is how accounts blow up without any single position being reckless: the risk was diversified by label and concentrated by driver.
Managing Correlation in Your Own Book
Count your true exposure by driver, not by instrument. The number of open positions means nothing if they all answer the same question.
Before adding any position, ask two things. What question does this trade answer? And does an open position already answer it?
If two trades would win or lose on the same headline, you have one trade twice. Either skip the second one, or size the pair as a single position.
A few habits that keep this manageable:
- Write the driver next to every open trade in your journal: "weaker dollar," "risk-on," "higher oil."
- Cap total risk per driver, not just per trade, as the risk per trade lesson explains. Two 1 percent risks on the same driver are a 2 percent risk.
- Recheck links after big regime events like rate decisions, elections, and wars. Old habits may no longer apply.
- Be extra skeptical of hedges built on correlation. Test what happens if the link fails.
Typical Links and What Breaks Them
| Market pair | Typical link | What tends to break it |
|---|---|---|
| US dollar vs gold | Usually opposite directions | Crisis buying that lifts both at once |
| Oil vs energy shares | Usually same direction | Company-specific news or broad equity selloffs |
| Oil vs exporter currencies | Usually same direction | Central bank action or domestic politics |
| Index vs its largest components | Strongly same direction | Rotation into smaller stocks or other sectors |
| Stocks vs riskier currencies | Often same direction in calm times | Rate shocks that hit the two differently |
Notice the pattern in the right-hand column. The breaker is almost always a new driver arriving and taking over from the old one.
Questions About Correlations
Do correlations stay stable over time?
No. Correlations drift with the economic regime and can flip sign entirely. A link measured over the past year may look nothing like the link over the past month, so always ask what period any correlation figure describes.
How do I check if two markets are correlated?
The simplest way is to put the two charts side by side over several timeframes and look for shared turns. Many charting platforms also offer a correlation coefficient indicator that does the math for you. Either way, check more than one timeframe, because a link that shows up on daily charts may vanish on hourly ones.
Should I hedge using correlated markets?
You can, but treat it as a reduction of risk, not an elimination of it. A hedge built on a negative correlation only works while the link holds, and links tend to fail in exactly the stressed conditions where hedges matter most. Size the hedge so you survive the link breaking.
Does correlation mean one market causes the other?
No. Correlation means two markets move together, not that one pushes the other. Usually both are responding to a shared third driver, like the dollar, rates, or the risk mood. Confusing the two leads to bad trades, because you end up watching the wrong signal.
Once you can read your book by driver instead of by instrument, the next step is position sizing across a whole portfolio, where correlation, volatility, and risk-per-trade come together into one framework.