The Five Ichimoku Lines, Explained
Ichimoku is built from five lines, and each one is simpler than it looks. The five lines are two equilibrium lines, Tenkan-sen and Kijun-sen, two projected lines that build the cloud, Senkou Span A and Senkou Span B, and one displaced close, Chikou. Each has a window, a shift, and one job.

The formulas are basic arithmetic. A midpoint is the highest high plus the lowest low, divided by two. An average of two lines is the two values added and divided by two. A shift means the value gets drawn at a different position on the time axis. That is the complete math load, and none of it requires a spreadsheet.
Think of the five lines as an orchestra: five sections reading the same score, and the sound only makes sense when all of them play together, with no section soloing. One line alone tells you very little. Five lines together describe where price sits relative to recent balance, where balance used to be, and where balance is projected to land.
This lesson covers what each line is and how it is computed. The companion system lesson handles how the five lines combine into bias and trade decisions, so that framework stays there. Here the focus is narrower: construction, one line at a time.
Tenkan-sen: the Fast Equilibrium
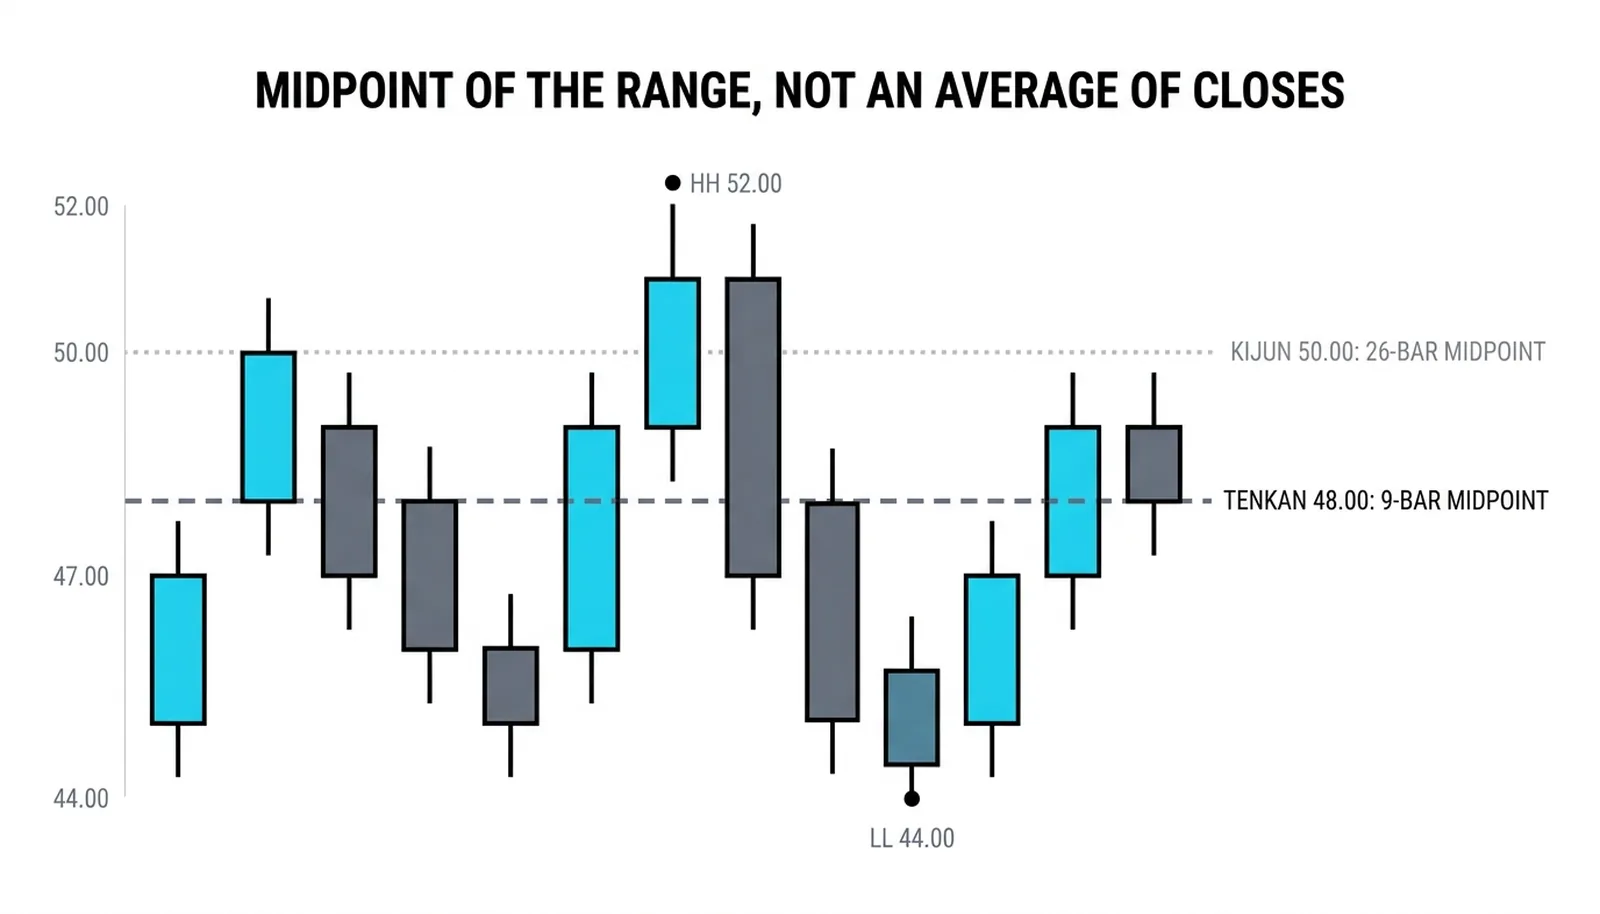
Tenkan-sen is the midpoint of the highest high and the lowest low of the last 9 bars. Add the two extremes, divide by two, and plot the result at the current bar. Recalculate every bar, connect the dots, and you have the line.
The choice of a midpoint over an average is deliberate. A moving average incorporates every close in the window, so a single extreme close pulls the whole line toward it. A midpoint only reads the two widest prints. Wicks cannot drag the Tenkan around, because a wick is already the extreme it measures.
The result is a line that marks the center of recent price action. When price sits on the Tenkan, the market is trading at the middle of its short-term range. When price stretches away from it, the market has moved far from that short-term balance point.
Because the window is only 9 bars, the Tenkan reacts quickly. It flattens during quiet consolidation and bends sharply during fast moves. Traders who expect it to behave like a smooth moving average get confused. It is not a smoother. It is a range marker.
Kijun-sen: the Base
Kijun-sen uses the same formula with a longer window: the midpoint of the highest high and lowest low over the last 26 bars. Same arithmetic, slower line.
Those 26 bars represent a longer stretch of trading, so the Kijun marks the equilibrium price for that period. Where the Tenkan shows the center of the recent range, the Kijun shows the center of the broader range. The two lines together give you short balance and long balance on one chart.
The shape of the Kijun carries information. A flat Kijun means the 26-bar high and low have stopped expanding, so price is balanced and the market is ranging. A rising or falling Kijun means the range itself is migrating, which is what a trend looks like in range terms.
Distance matters as much as direction. When price trades far above the Kijun, it has stretched well beyond the month's equilibrium. Stretch like that often precedes either a pullback toward the line or a pause while the line catches up. A far-away Kijun is a warning label, not a buy signal.
On the periods themselves: the 9 and 26 windows are units of the old trading week on a daily chart, roughly a week and a half and a month of sessions. They are not tuned magic numbers discovered through optimization. They came from the Japanese trading week the system's creator worked with.
The Two Spans That Build the Cloud
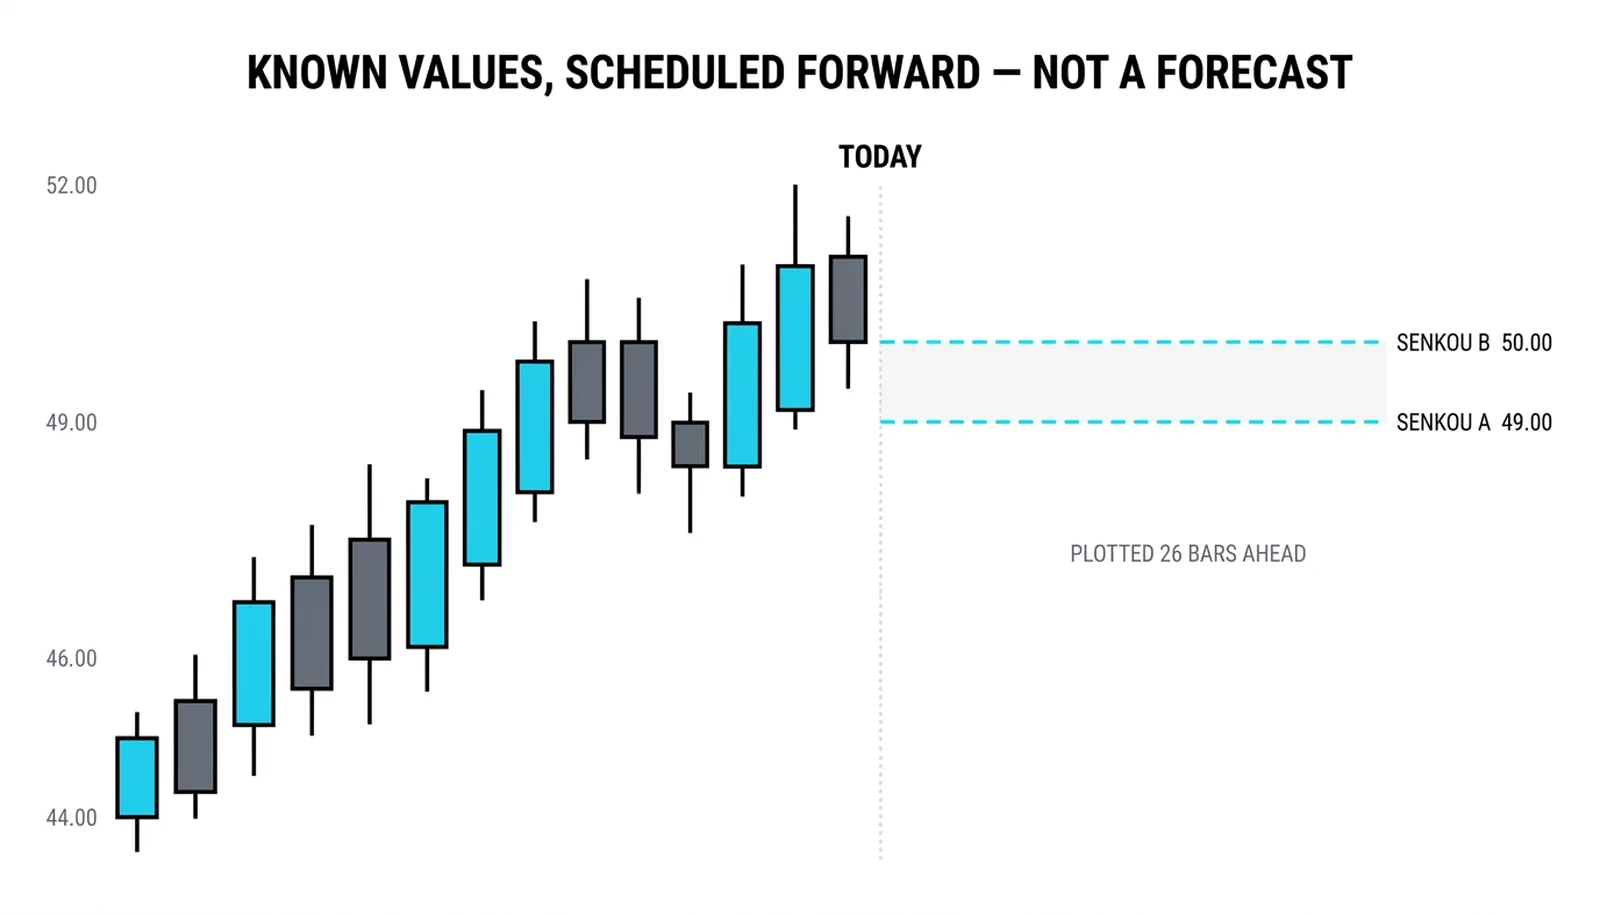
Senkou Span A takes the Tenkan and the Kijun, averages them, and plots the result 26 bars into the future. It blends the fast equilibrium and the slow equilibrium into one value, then pushes that value forward on the chart.
Senkou Span B is the midpoint of the highest high and lowest low over 52 bars, also plotted 26 bars ahead. It is the slowest calculation in the system, the long-range center of gravity.
The space between the two spans is the cloud, often shaded so the eye picks it up instantly. When Span A sits above Span B, the cloud shows one color; when they swap, the color flips. The thickness of the cloud reflects how far apart the short-blend and the long midpoint have drifted.
The forward shift confuses new readers, so be clear about what it is. The values are computed from past data only. Nothing is predicted. The shift simply displays today's equilibrium readings at a future position, so you can see in advance where those levels will sit if price reaches them. It is a scheduling choice, not a forecast.
Because Span B uses 52 bars, it moves slowly and tends to hold flat for long stretches. Span A, built from faster inputs, bends more easily. The interplay of a fast span and a slow span gives the cloud its shape and its changes of color.
Chikou: Today's Close, Drawn in the Past
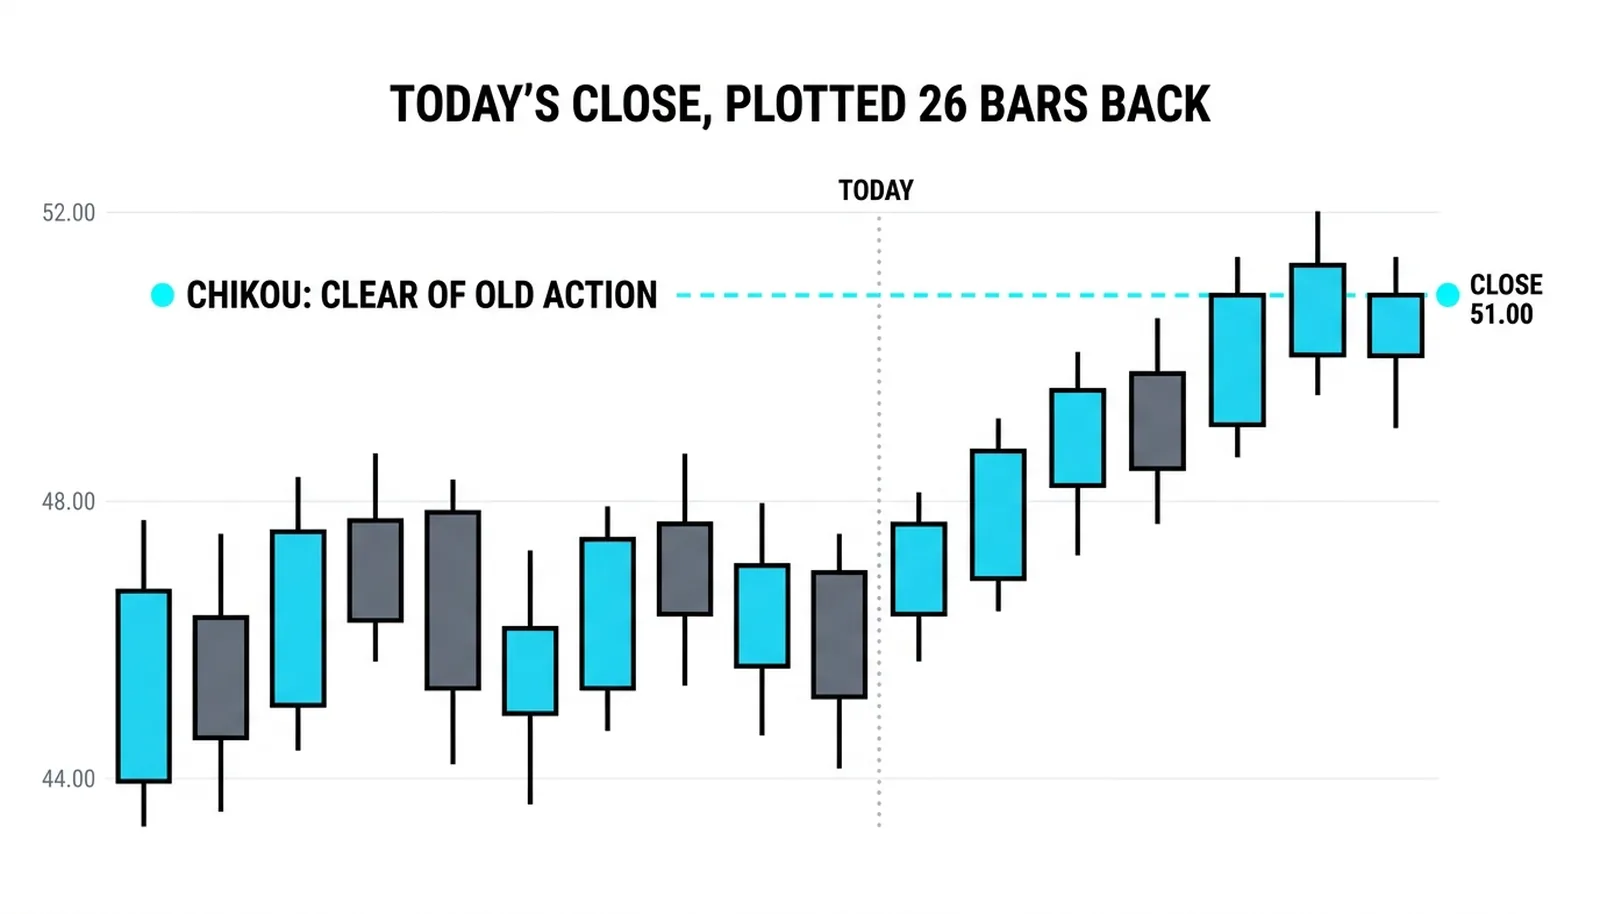
Chikou is the current closing price shifted 26 bars backward on the chart. No averaging, no midpoint, no math at all. Just the close, relocated.
The point of the shift is comparison. By drawing today's close 26 bars back, the chart lets you compare the current price directly against the price action of a month ago, at the same horizontal position. Your eye does the work instantly.
If the Chikou sits above the historical price action at that displaced position, today's close is higher than anything the market did back then. If it sits below that old price action, today's close is weaker than the past range. The line turns an awkward cross-chart comparison into a glance.
One practical detail: the Chikou collides with old candles, and those collisions are the information. Where the displaced close runs into past congestion, the current move is pushing into territory where traders once made decisions. Where it floats in open space, the current price has cleared that history.
Computing the Lines by Hand
Worked examples make the formulas stick. The numbers below are invented round figures for illustration, not readings from any real market.
Tenkan-sen: the last 9 bars show a highest high of 52 and a lowest low of 44. The midpoint is (52 + 44) / 2 = 48. Tenkan is 48.
Kijun-sen: the last 26 bars show a highest high of 55 and a lowest low of 45. The midpoint is (55 + 45) / 2 = 50. Kijun is 50.
Senkou Span A: average the two equilibrium lines, (48 + 50) / 2 = 49, and plot that value 26 bars ahead of the current bar. Span A is 49, drawn in the future.
Senkou Span B: the last 52 bars show a highest high of 60 and a lowest low of 40. The midpoint is (60 + 40) / 2 = 50, plotted 26 bars ahead. Span B is 50, also drawn in the future.
Chikou: today's close is 51. Plot 51 at the position 26 bars in the past. In this example, that displaced close sits above the old price action at that spot, which tells you the current close has cleared what the market was doing a month ago.
Five lines, five one-line calculations. The table below collects them.
| Line | Window | Shift | One-line job |
|---|---|---|---|
| Tenkan-sen | 9 bars | None | Marks the short-term equilibrium, the midpoint of the recent range |
| Kijun-sen | 26 bars | None | Marks the longer equilibrium, the balance price for roughly a month |
| Senkou Span A | Built from Tenkan and Kijun | 26 bars forward | Blends the two equilibriums and projects the blend ahead |
| Senkou Span B | 52 bars | 26 bars forward | Marks the long-range midpoint, the slow edge of the cloud |
| Chikou | Current close only | 26 bars backward | Compares today's close against price action from a month ago |
Common Questions About the Ichimoku Lines
Why does Ichimoku use midpoints instead of averages?
Midpoints measure the range itself rather than the distribution of closes inside it. A moving average reacts to every close in the window, so a cluster of extreme closes pulls it off center. A midpoint only reads the widest high and the widest low, which makes it a stable marker of where the range sits. The system's designer wanted equilibrium levels, and the midpoint of a range is the cleanest definition of equilibrium available.
What do the 9, 26, and 52 settings mean on a daily chart?
They are units from the Japanese trading week, not optimized secrets. On a daily chart, 9 bars is roughly a week and a half of sessions, 26 is roughly a month, and 52 is roughly two months. The settings came from the Japanese trading week the system's creator worked under, where markets ran six days. They persist because they map neatly onto chunks of the trading week, not because backtests crowned them.
Why are the Senkou spans drawn in the future?
The forward shift is a display decision, not a prediction. Both spans are computed entirely from past data, then plotted 26 bars ahead so you can see where those equilibrium levels will sit as price approaches them. The chart is scheduling known values forward. Nothing about the calculation looks ahead.
Is Chikou a signal line or a confirmation line?
Chikou works best as a confirmation line. It generates no levels of its own, since it is only the close moved backward, so it cannot trigger anything by itself. What it does is confirm or contradict what the other lines suggest, by showing whether today's close has genuinely cleared the price action of a month ago. Treat it as the vote that validates the rest of the system, and remember that the companion lesson on the full Ichimoku framework covers how that vote gets counted.