What Pure Price Action Trading Really Means
Pure price action trading means making every decision from the chart's own record: the prices that actually traded, printed over time, and optionally the volume they traded on, with no derived indicators sitting on top. The chart is the market's logbook, written by every trade as it happened, and indicators are secondhand retellings of that logbook. A trader working pure reads the original entries, not someone else's summary of them.

Think of it as reading the ship's own logbook rather than a summary someone wrote about it later. Every bar is an entry made at the moment of the event, not reconstructed afterward. This is the entire claim the pure approach makes: the freshest, least filtered evidence available is the tape itself.
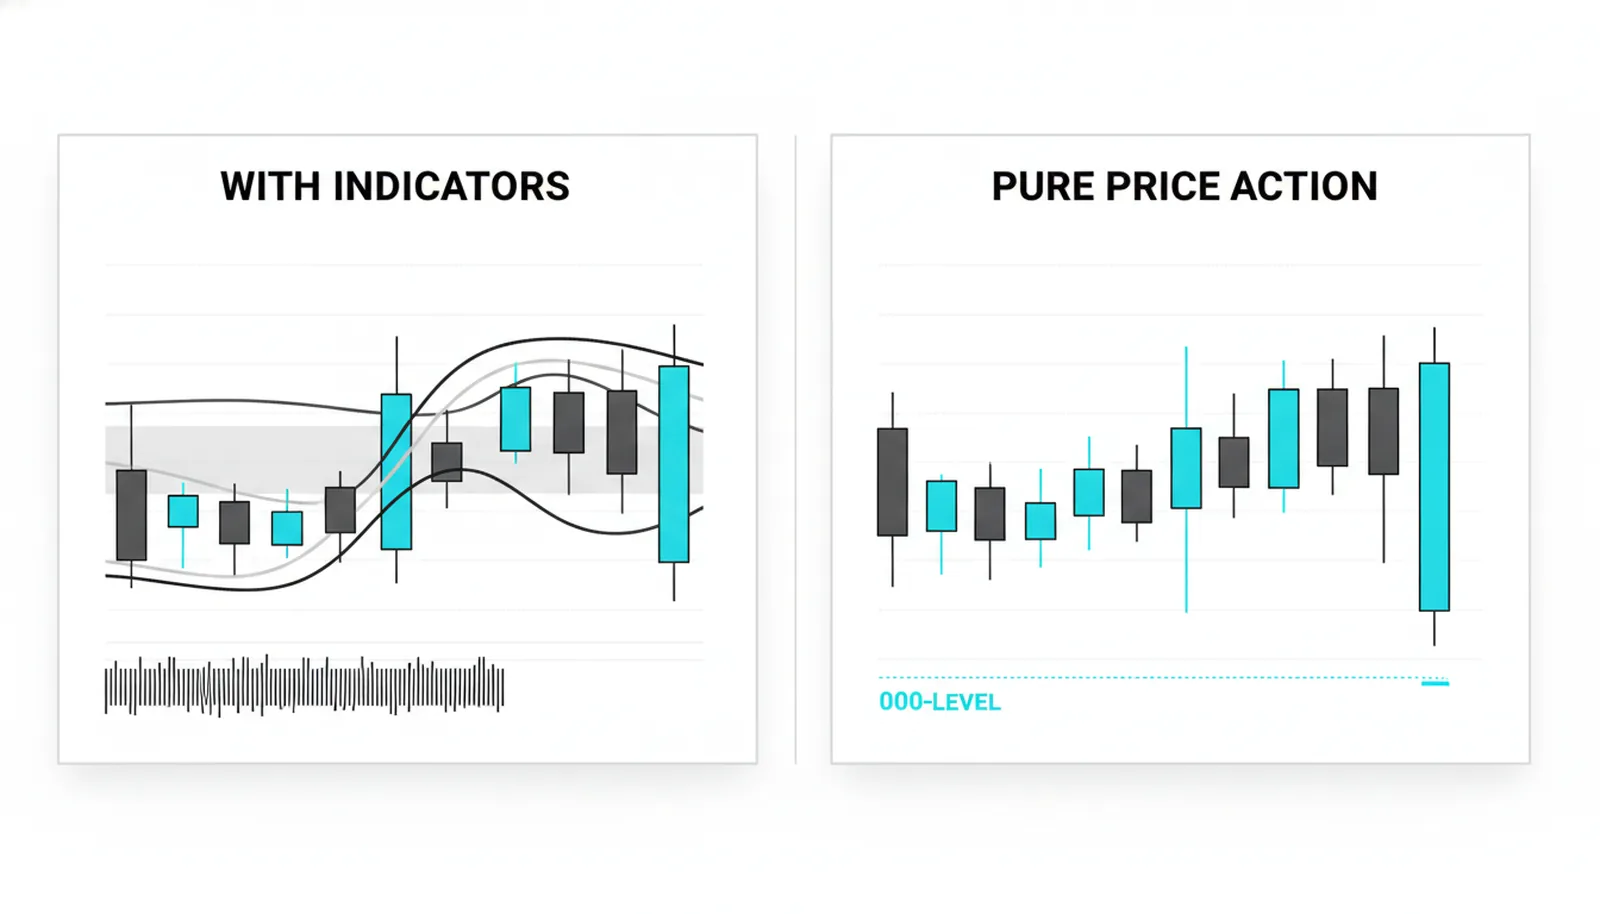
An earlier lesson in this series compared price action against indicators and argued for a blend of the two. This lesson covers the other end of that spectrum: the method in its strictest form, with nothing between the trader and the printed record.
What Counts as the Chart's Own Record
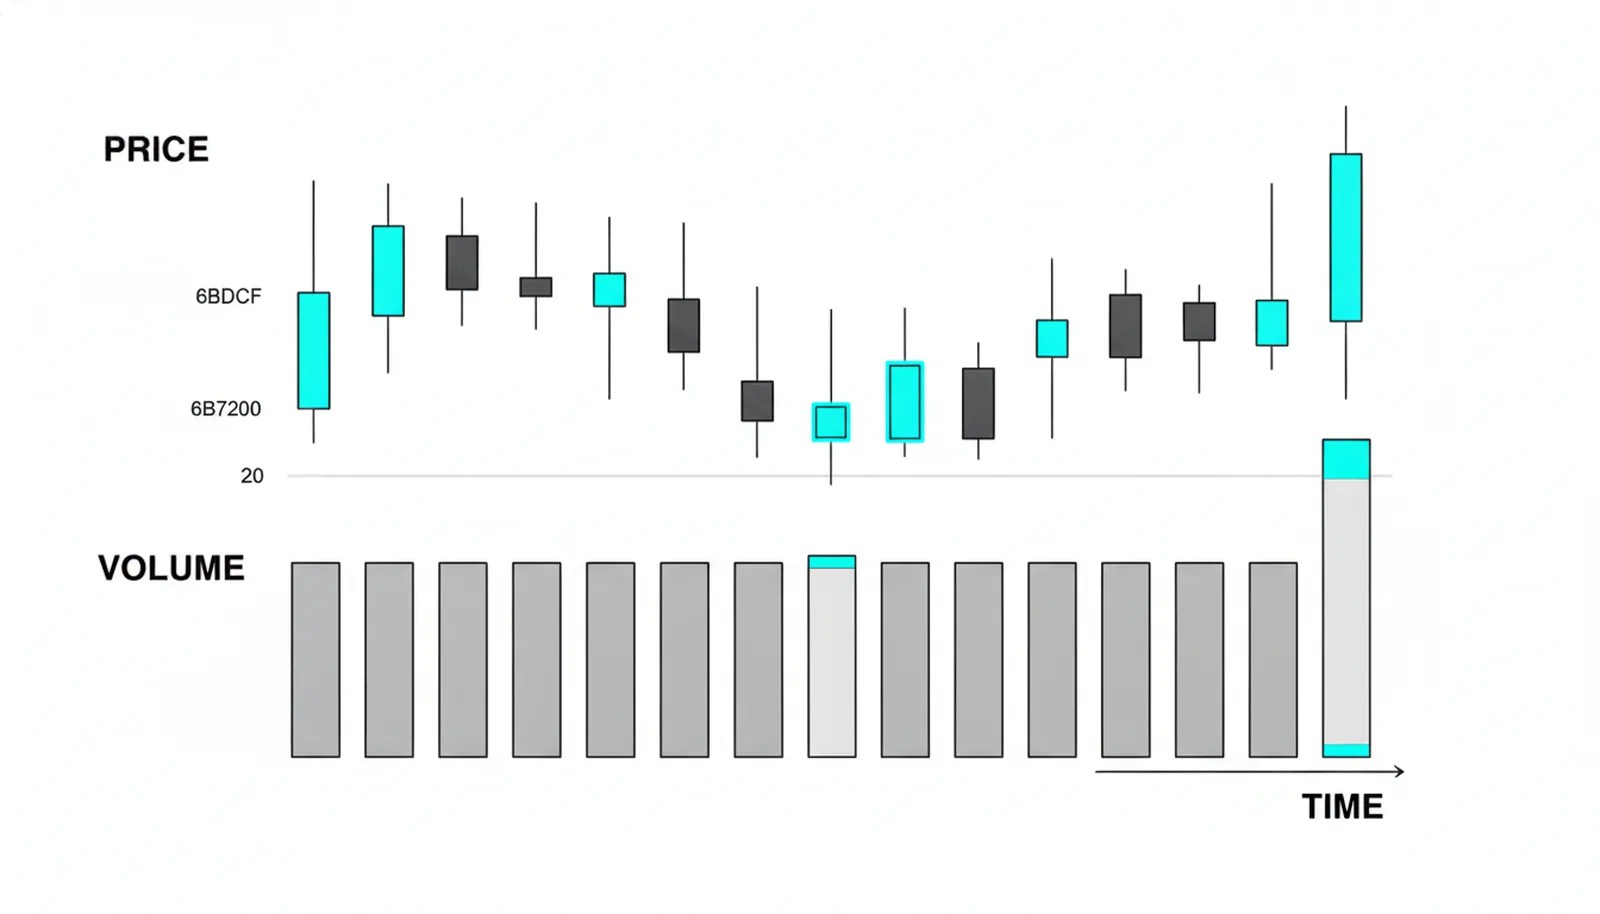
The chart's own record is short and concrete. It is price bars, each one carrying an open, a high, a low, and a close. It is the time each bar printed at. And it is volume, if the trader chooses to include it.
Volume belongs on the list because volume is printed fact, not a calculation. When 50,000 shares change hands in a five-minute bar, that number happened. Nobody derived it from anything. It sits in the record the same way the high and low do.
Everything else on a typical chart is a step removed. A moving average is arithmetic performed on old closes. An oscillator is arithmetic performed on the arithmetic. Each layer adds distance between the trader and the event.
Distance is the argument. A pure trader wants to react to what the market did, not to a formula's opinion about what the market did. The opinion may be useful, but it is still an opinion, and it always arrives after the fact it describes.
What Pure Removes and What It Keeps
Pure removes every derived overlay. Moving averages go. Oscillators go. MACD, RSI, stochastic, Bollinger Bands, anything computed from price rather than printed by the market, all of it comes off the chart.
What stays is the trader's own marks. Support and resistance lines drawn at levels where price actually turned. Trendlines connecting real swing points. Annotations noting a gap, a failed breakout, a level that held three times. These are readings of the record, not summaries of it, so they survive the purge.
The distinction matters. A horizontal line at a price where sellers appeared twice is a label on a fact. A 20-period average is a new piece of data invented by a formula. One points at the evidence; the other adds to it.
The price action canon is the sharpest modern example of the strict approach, with an entire method built on bare bars, and it states plainly that indicator-derived opinions are not needed for any price action trade. Whether a trader goes that far or not, the position defines the end of the spectrum this lesson describes.
The Honest Limits
Pure is a discipline, not a purity contest. The trader who strips the chart clean and then sneaks one moving average back as a crutch has chosen a blend. That is a legitimate choice, and the earlier lesson in this series defends it, but it should be called what it is.
Here is the blunt version. Removing indicators does not make patterns more reliable.
What it removes is a layer of distance from the evidence. The pullback still fails sometimes. The level that held twice still breaks on the third test. The probabilities do not improve because the chart got cleaner; the trader simply sees the same uncertainty with fewer filters in the way.
The work of reading the chart honestly remains exactly as hard as it was. A bare chart demands more skill per glance, not less, because every judgment now rests on the trader's own reading of structure, momentum, and context. There is no crossover to blame when the read goes wrong.
That trade-off suits some temperaments and frustrates others. Traders who want a second opinion on every decision will find the strict version lonely. Traders who distrust derived signals will find it clarifying. Both reactions are reasonable.
The Same Chart Twice
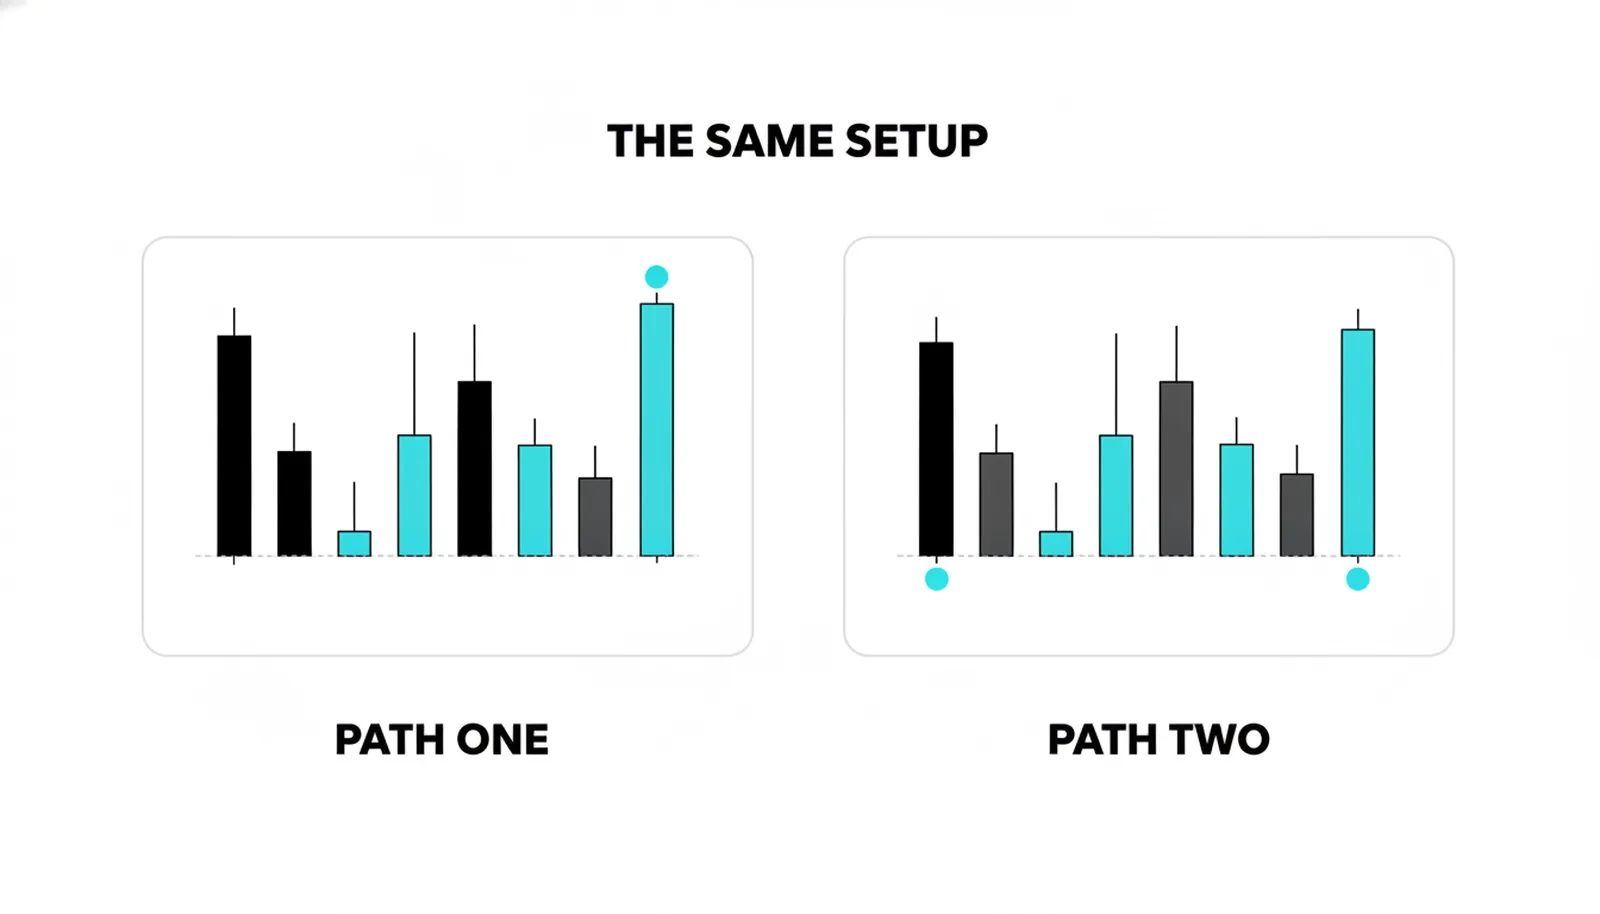
A hypothetical illustration with round numbers. A stock's chart carries a 20-period average, two oscillators, and a trend ribbon stacked on top of the price. Price sits at 96.40, having pulled back toward a level marked at 96.20.
The read from the stacked chart is a tangle. One oscillator has crossed down, the other has curled up, price has dipped below the average but the ribbon still slopes upward. Three tools point three directions at once, and the trader freezes, waiting for agreement that never quite arrives.
Now strip the chart naked. The same price history shows a clean pullback to a level that held twice before. The most recent bar dipped to 96.20 and closed back above it, printing a long lower wick. The prior swing high sits at 97.80, a natural first target.
The read is direct: buyers defended 96.20 again, the close confirms it, and a measured objective sits 1.60 above. Risk to a stop below the wick is small and definable. Nothing about this read required a formula.
The point is not that the naked chart was right and the stacked chart was wrong. The point is that the evidence was on the chart both times. The overlays buried it under layers of commentary, and the commentary disagreed with itself.
| Chart element | Kept or dropped | Why | What replaces it |
|---|---|---|---|
| Price bars with open, high, low, close | Kept | Printed fact, the record itself | Nothing needed |
| Volume | Kept | Printed fact, counted not computed | Nothing needed |
| 20-period moving average | Dropped | Derived from old closes, lags the record | Visible swing structure and trend direction |
| Oscillators and trend ribbon | Dropped | Second-order calculations on price | Bar-by-bar momentum read from the bars themselves |
Questions About Pure Price Action
What is pure price action trading?
Pure price action trading is making every decision from the chart's own record: the prices that actually traded, printed over time, with volume as optional supporting evidence. No derived indicators sit between the trader and the tape. The trader reads structure, levels, and bar behavior directly from the printed bars.
Does pure price action use any indicators at all?
No, the strict version uses none. Moving averages, oscillators, bands, and any other computed overlay are all excluded because they are calculated from price rather than printed by the market. What remains are the bars, the time axis, optionally volume, and the trader's own hand-drawn levels and notes.
Is pure price action better than using indicators?
Neither approach holds a proven edge over the other; they are different relationships with the same evidence. Pure removes a layer of distance and a source of conflicting signals, while indicators can add structure and discipline for traders who want a mechanical cross-check. The earlier lesson on blending the two covers the middle ground most traders actually occupy.
Can a beginner trade pure price action?
Yes, and many teachers argue beginners should start there, because a bare chart forces the core skills early: reading structure, marking levels, and judging momentum from the bars themselves. The catch is that nothing on a naked chart confirms the read, so progress depends on honest review of past decisions. A beginner who journals every trade against the printed record builds the skill faster than one who waits for indicator agreement.
The next lesson in this level takes the same record and asks a deeper question: why the auction process behind those prints makes the record readable at all.