Exhaustion: When a Move Runs Out of Fuel
Exhaustion is the end of a move, and it arrives when the side driving price finally runs out of orders to initiate. The last buyers or sellers push price to one final, dramatic extreme, the opposing side slams the auction back the other way, and the trend is over. Market profile theory calls this excess, and it counts excess as the second and most common way a trend ends.

Think of a soda that has gone flat. The liquid still sloshes when you tip the glass, but the fizz that carried it is gone. Price can still stretch, still print new highs or lows, yet the initiating energy behind the move has drained away. Learning to read that difference, between motion and fuel, is what this lesson is about.
The earlier lessons in this block built the tools: delta, cumulative delta, the per-bar view, and absorption. This lesson owns the moment those tools were built to catch. Everything before was instrumentation. This is the reading.
The Two Ways a Move Ends
A trend does not die one way. It dies two ways, and they look completely different on the chart.
The first death is quiet. Liquidity simply dries up. Fewer orders show up on either side, the range narrows, and price drifts sideways into nothing. No drama, no spike, no climax. The move just stops being fed, and the market wanders off to find business elsewhere. Many traders never notice this ending because there is nothing dramatic to notice.
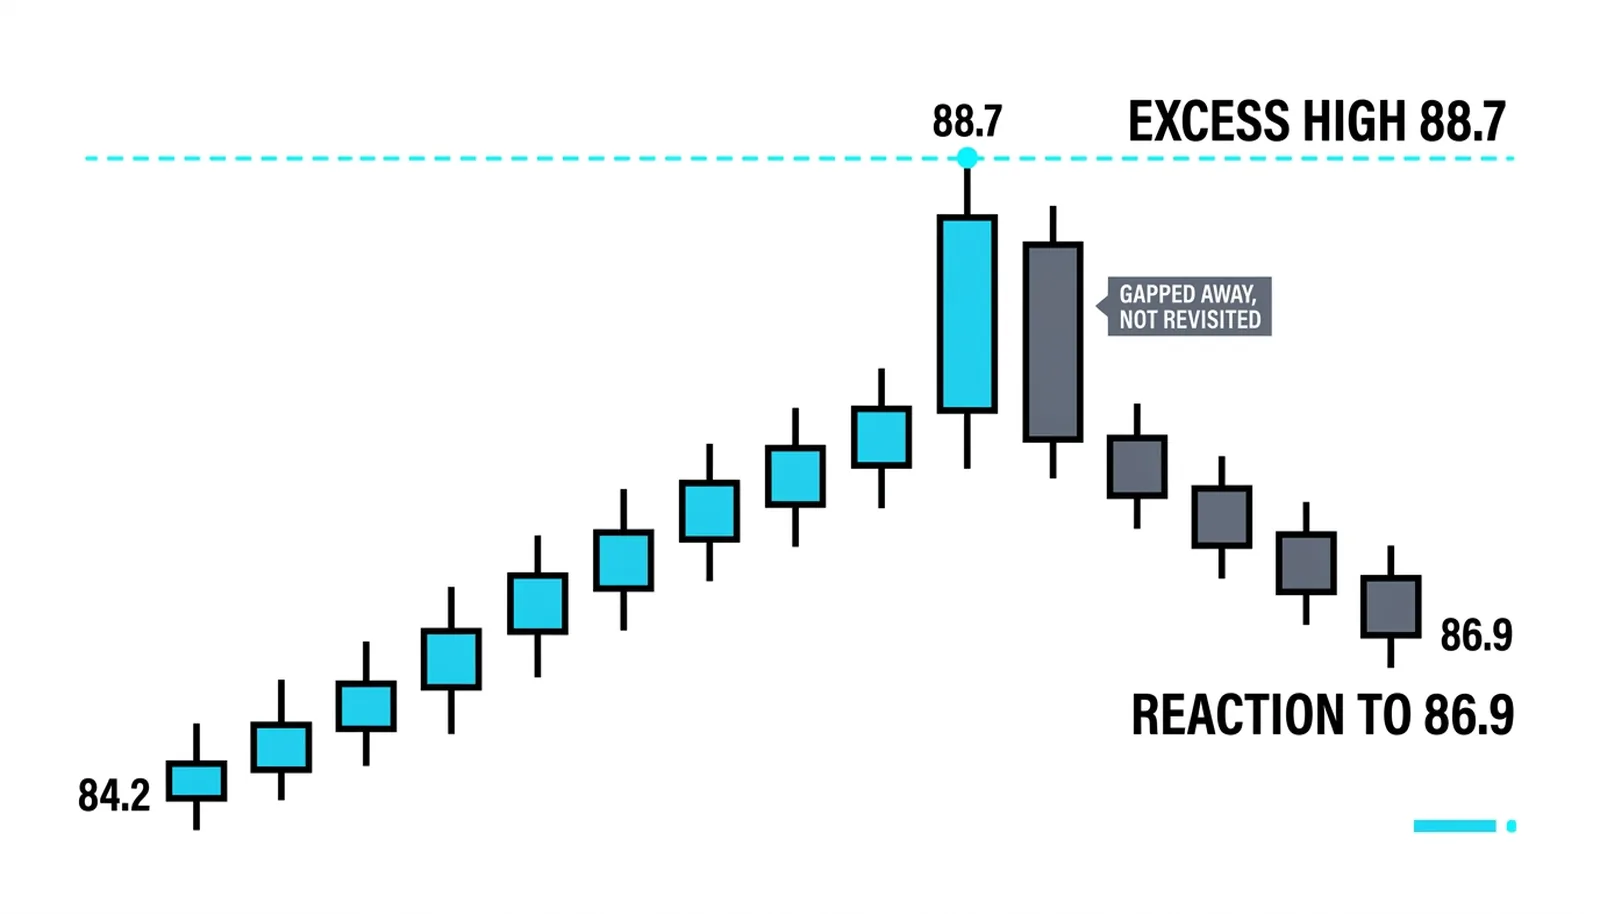
The second death is violent. Price auctions to a dramatic high or low on relatively low volume, and opposing traders react quickly and aggressively, auctioning price hard in the other direction. The extreme itself is the tell. It looks like strength. It is actually the last gasp.
The logic underneath is about fairness. When price auctions so high that the market deems it unfair for the buyer, trade stops being done up there. Buyers refuse to pay. Sellers step in with size. Sometimes the market gaps away from the extreme afterward, and that gap is further acknowledgment that the extreme price was rejected, not accepted. An accepted price gets revisited and traded around. A rejected price gets left behind.
The order flow framework's warning about turning points applies in full: it is precisely at the ends of moves that deception takes place, and exhaustion is where that warning earns its keep.
So the split is simple. One ending starves. The other ending snaps.
Your job as a reader is different in each case. The quiet ending asks for patience and a willingness to stand aside. The violent ending asks for evidence, because the extreme bar alone proves nothing yet.
What the Tools Show at the Extreme
Here is where the block's earlier work pays off. Three readings matter at a suspected top or bottom, and the strongest case comes when all three agree.
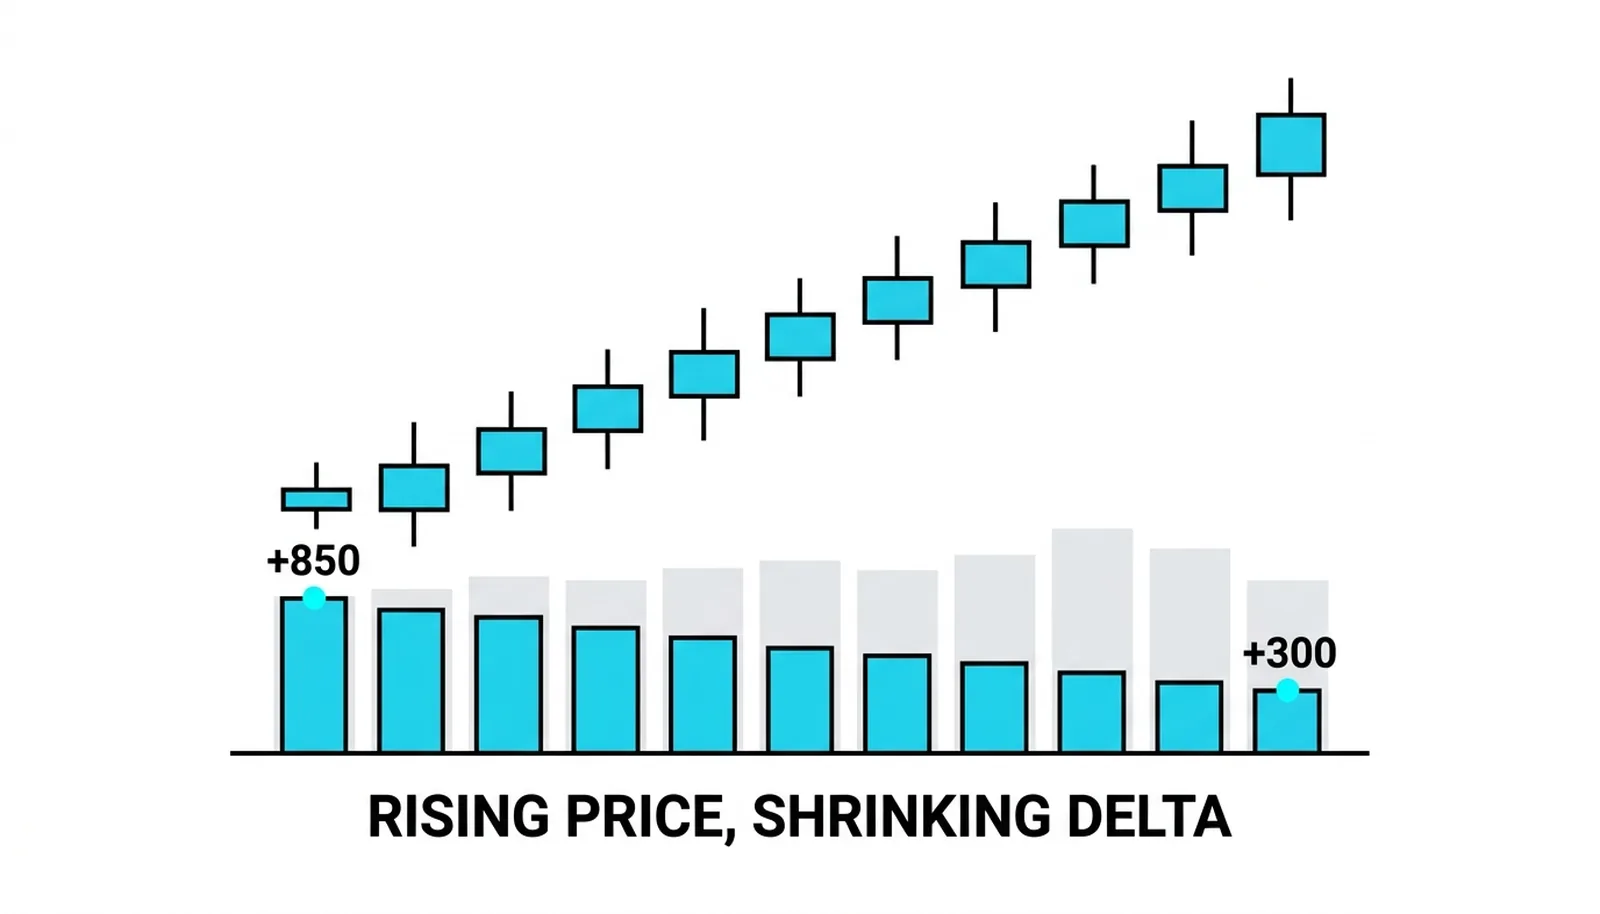
First, per-bar delta shrinks while closes still extend. Price keeps making new highs, but each bar's net buying gets smaller. The closes are rising on declining initiative. Early in a healthy trend, new highs come with expanding delta, fresh buyers hitting offers harder each bar. Late in a dying trend, the highs continue on fumes. The pattern reads: plus 900, plus 600, plus 300, while price still edges upward. Rising price on shrinking delta is the single most common signature of a move running dry.
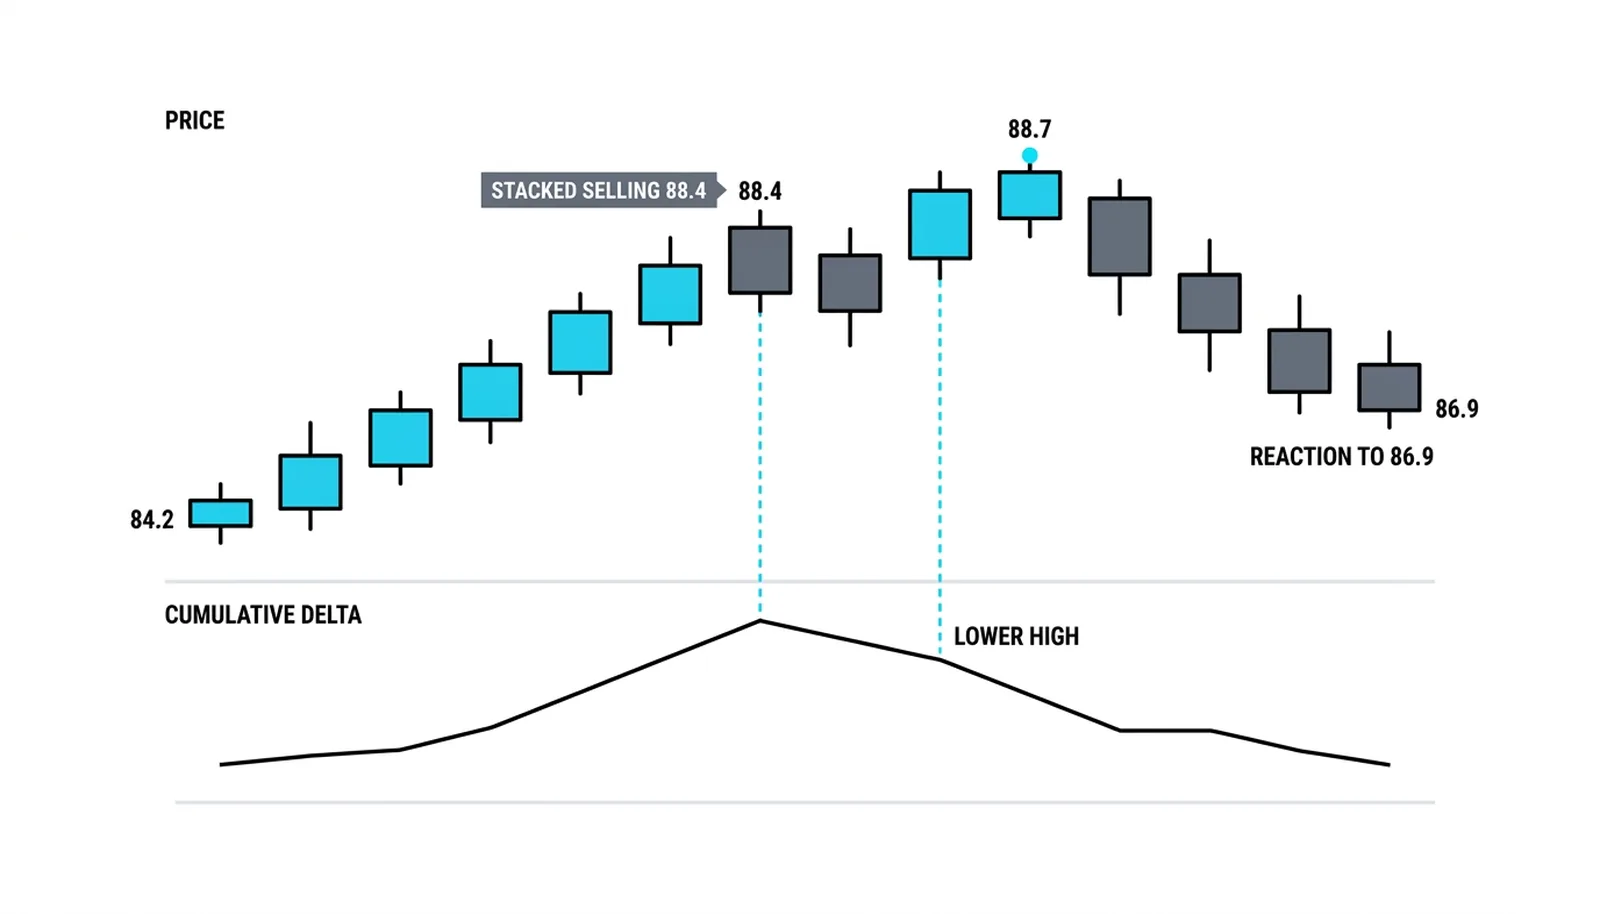
Second, cumulative delta prints a lower high at the price extreme. Price makes a new high for the move. The running total of net market orders does not. That divergence means the aggregate initiating pressure peaked earlier, and this final price high was achieved with less total effort than the previous one. Price lied. The running total told the truth.
Third, the climax bar itself. Often the extreme arrives on one last burst of volume, the heaviest bar of the entire sequence, and then the bar closes mid-range or worse. Heavy volume with a poor close means enormous effort produced almost no result. Sellers met every market buy with passive supply, absorbed the aggression, and held the line. That is absorption showing up at the worst possible moment for the trend, exactly where the earlier absorption lesson said to watch for it.
Stack the three together and the picture is coherent. Shrinking per-bar delta says initiative is fading. A lower cumulative high says total effort already peaked. A huge-volume bar closing off its extreme says the final push was absorbed. None of these alone is a signal. Together they describe a side of the market that has spent itself.
Confirmation Decides, Not the Stretch
Exhaustion is proven by the reaction, never by the extreme itself. Write that on a sticky note and put it on the monitor.
The classic way early sellers get run over is calling the top on one stretched bar. Price extends, delta thins, the trader shorts into strength, and then the move squeezes another leg higher and takes the stop. Stretched is not finished. Markets can stay stretched far longer than an early entry can stay solvent. The extreme is a location to pay attention, not a location to act.
The disciplined read waits for one of two things. Either price breaks structure, taking out the prior swing low after the high, or a stacked imbalance prints in the opposite direction, showing aggressive sellers now initiating with force. Both say the same thing: the other side has taken control of the auction. Only then has exhaustion moved from hypothesis to evidence.
The second caution cuts the other way. A dramatic extreme on falling delta can also be a pause before continuation. If the pullback holds inside the prior range, if selling pressure never builds, and if buyers re-initiate above the extreme, the move resumes and the "exhaustion" reading was just a rest stop. Trends often breathe. One deep exhale is not death.
So location and confirmation decide. A stretched bar at a major prior high, with shrinking delta and a cumulative divergence, deserves attention. A stretched bar in the middle of nowhere deserves nothing. And neither deserves a position until the reaction proves the case.
The Last Push to 88.7
A hypothetical stock climbs from 84.2 to 88.7 over three sessions. The trend looks healthy on the price chart alone. The order flow tells a different story, stage by stage.
The final push prints three rising closes. The first bar closes higher on a delta of positive 850. The second closes higher still on positive 620. The third closes higher again on positive 300. Three up-closes, three shrinking deltas. Buyers are still lifting price, but each push takes less conviction than the one before. The fuel gauge is falling while the car still rolls forward.
The third bar is also the volume climax. It trades 2.3 times its average volume, the heaviest bar of the entire move, and closes at 88.2, well off its 88.7 high. Enormous effort, weak result. Someone sold into every bit of that buying and price could not hold the extreme. That bar is the candidate excess print: a dramatic high, met with aggressive opposition, rejected.
The next bar cannot reach 88.7. Price stalls below the extreme while cumulative delta prints a lower high, meaning total net buying across the whole sequence peaked before the price did. Then a stacked selling imbalance prints near 88.4, aggressive sellers hitting bids in size, multiple levels deep. That imbalance is the confirmation. The reaction has begun.
Over the following two sessions, price auctions down to 86.9. The move from 84.2 is finished, ended by excess at 88.7, confirmed by the imbalance at 88.4, and validated by the break of the prior swing structure on the way down.
Now the cancellation case. If, instead of stalling, buyers had re-initiated above 88.7 on expanding delta, the exhaustion read would be void. If the pullback had held above, say, 87.8 and then price traded back through the high with fresh buying, the climax bar would be reclassified as a pause, and shorting it would have been the trap. The extreme invited the hypothesis. Only the reaction was allowed to confirm it, and only continued strength was allowed to kill it.
| Sign at the extreme | What it says | What it does not say | The trap |
|---|---|---|---|
| Shrinking per-bar delta on rising closes | Initiating pressure is fading with each push | That the move must reverse immediately | Shorting the first thin-delta bar into a continuing squeeze |
| Cumulative delta lower high at a price higher high | Total net effort peaked before price did | Where the reversal will start | Treating divergence alone as an entry signal |
| Climax volume bar closing off its extreme | The final push was absorbed by passive sellers | That absorption cannot be overwhelmed later | Assuming one heavy bar ends the trend by itself |
| Stacked imbalance against the trend after the extreme | The opposing side has taken control of the auction | How far the reaction will travel | Chasing the confirmation late with no defined risk |
Exhaustion, Answered
What is exhaustion in trading?
Exhaustion is the end of a directional move, occurring when the side driving price runs out of initiating orders. It shows up either as liquidity quietly drying up and price drifting sideways, or as excess, a dramatic price extreme on low conviction that the opposing side aggressively auctions back the other way.
How is exhaustion different from a normal pullback?
A pullback pauses inside the trend and then the original side re-initiates; exhaustion ends the auction entirely. The difference is proven by what happens after the extreme: if the opposing side breaks structure or prints stacked imbalances, the move is finished, and if the original side re-initiates above the extreme, it was only a pause.
Can exhaustion be seen before the reversal?
The conditions can be seen building, but the event cannot be confirmed before the reaction. Shrinking delta, a cumulative lower high, and an absorbed climax bar all warn that fuel is low, yet none of them proves the tank is empty until the other side takes control of price.
What confirms an exhaustion call?
Confirmation is a break of structure or a stacked imbalance in the opposite direction, printed after the extreme. Either one shows aggressive opposing initiative, and that reaction is the only evidence that the extreme was rejection rather than a pause.
Next, the block turns from what the bars show to what the resting orders show: the order book heatmap, where liquidity sits before it ever trades, and how to read the walls that never intended to be filled.