Financial Statements: The Three Documents
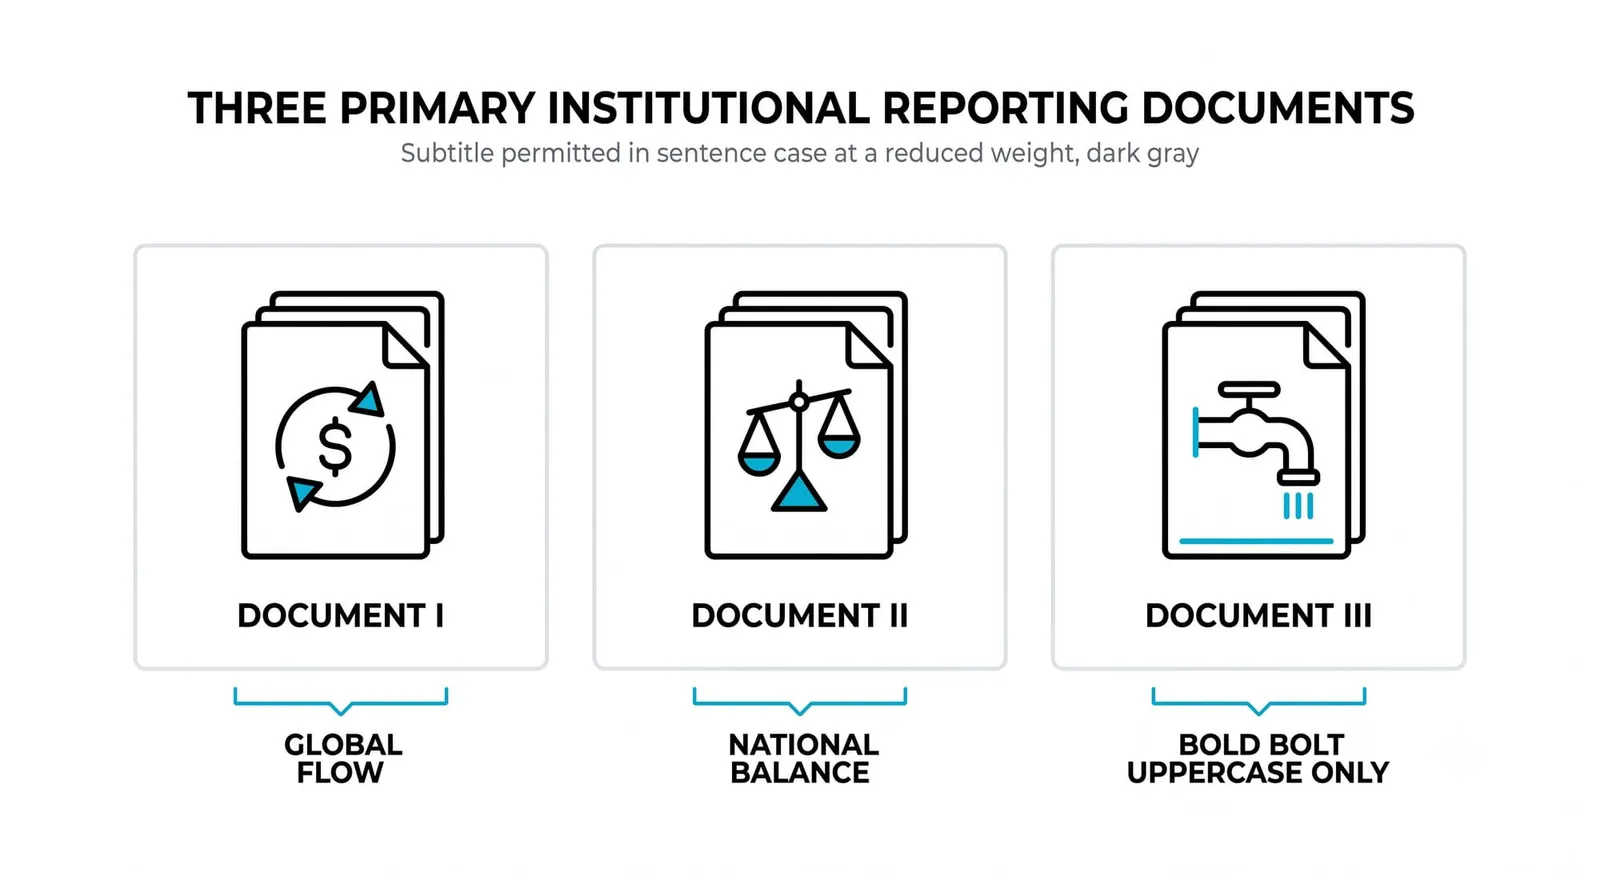
Financial statements come in three core documents: the income statement, the balance sheet, and the cash flow statement. Each one measures a different thing about the same company. That is why serious readers never rely on a single page. One document tells you how the business performed. Another tells you what it owns and owes. The third tells you where the cash actually went. Together they form the complete picture, and any one of them alone can mislead you.

Think of the three statements as a weather station with three instruments: a thermometer, a barometer, and a rain gauge each measure something real about the same patch of sky, and the honest forecast uses all three. The previous lesson covered what a financial statement is and why companies publish them. From here, the route is set: the income statement gets its own lesson next, then the balance sheet, then the cash flow statement. This lesson is the map of all three.
The Income Statement: Performance Over a Period
The income statement measures performance across a stretch of time, start to end. It covers a quarter or a full year, and it answers one question: did the business earn more than it spent during that period?
The structure is simple. Revenue sits at the top. Expenses come off in layers, and what remains at the bottom is net profit. You will hear people call it the bottom line for exactly that reason.
Because it covers a period, the income statement has a beginning and an end. A company can look wonderful over one quarter and terrible over the next. That is why experienced readers always look at several periods in a row, never one in isolation.
Keep one caution in mind. Profit on this page is an accounting figure, built from rules about when revenue and expenses get recorded. It is not the same as cash in the bank. That gap is where the third document earns its keep.
The Balance Sheet: Position at a Point in Time
Where the income statement covers a stretch, the balance sheet covers an instant. It shows the company's position on one single date, usually the last day of the quarter or the year.
It lists three things. Assets are what the company owns or is owed: cash, inventory, equipment, money customers still owe. Liabilities are what the company owes: debt, unpaid bills, obligations of every kind. Equity is what is left for the owners after the debts are accounted for.
The whole document hangs on one equation: assets equal liabilities plus equity. It always balances, because equity is defined as the difference. If a company owns 100,000 of stuff and owes 60,000, equity is 40,000. No exceptions.
Read two balance sheets from different dates side by side and you can see the business changing: debt rising or falling, cash building or draining, equity compounding or eroding. One date gives you a position. Two dates give you direction.
The Cash Flow Statement: Where the Money Actually Moved
This document tracks actual cash in and out over the period, and it splits the movement into three sections.
- Operating activities: cash generated or consumed by the core business, starting from profit and adjusting for everything that was not cash.
- Investing activities: cash spent on or received from long-term assets, like buying equipment or selling a division.
- Financing activities: cash moving between the company and its funders: borrowing, repaying debt, issuing shares, paying dividends.
Profit and cash move differently because accounting records revenue when it is earned, not when it is collected. A company can book a large sale, report a healthy profit, and still be waiting months for the customer to pay. The income statement calls that a good period. The cash flow statement tells you the money has not arrived.
Many a company has reported rising profits while its cash quietly shrank. That divergence is one of the oldest warning signs in financial analysis, and you can only see it by reading both documents.
How the Three Documents Connect to Each Other
The three statements are not separate reports. They are three views of one system, and the system has explicit links.
Start with the income statement. Net profit at the bottom flows into equity on the balance sheet, as retained earnings. Whatever the company keeps after dividends adds to what the owners hold.
Then look at cash. The cash flow statement explains, line by line, why the cash balance on the balance sheet changed from the start of the period to the end. The closing cash figure on the cash flow statement is the same number sitting in the assets section of the balance sheet.
Depreciation ties them together too. It reduces profit on the income statement, gets added back in the operating section of the cash flow statement because no cash left the building, and shrinks the value of equipment on the balance sheet. One event, three footprints.
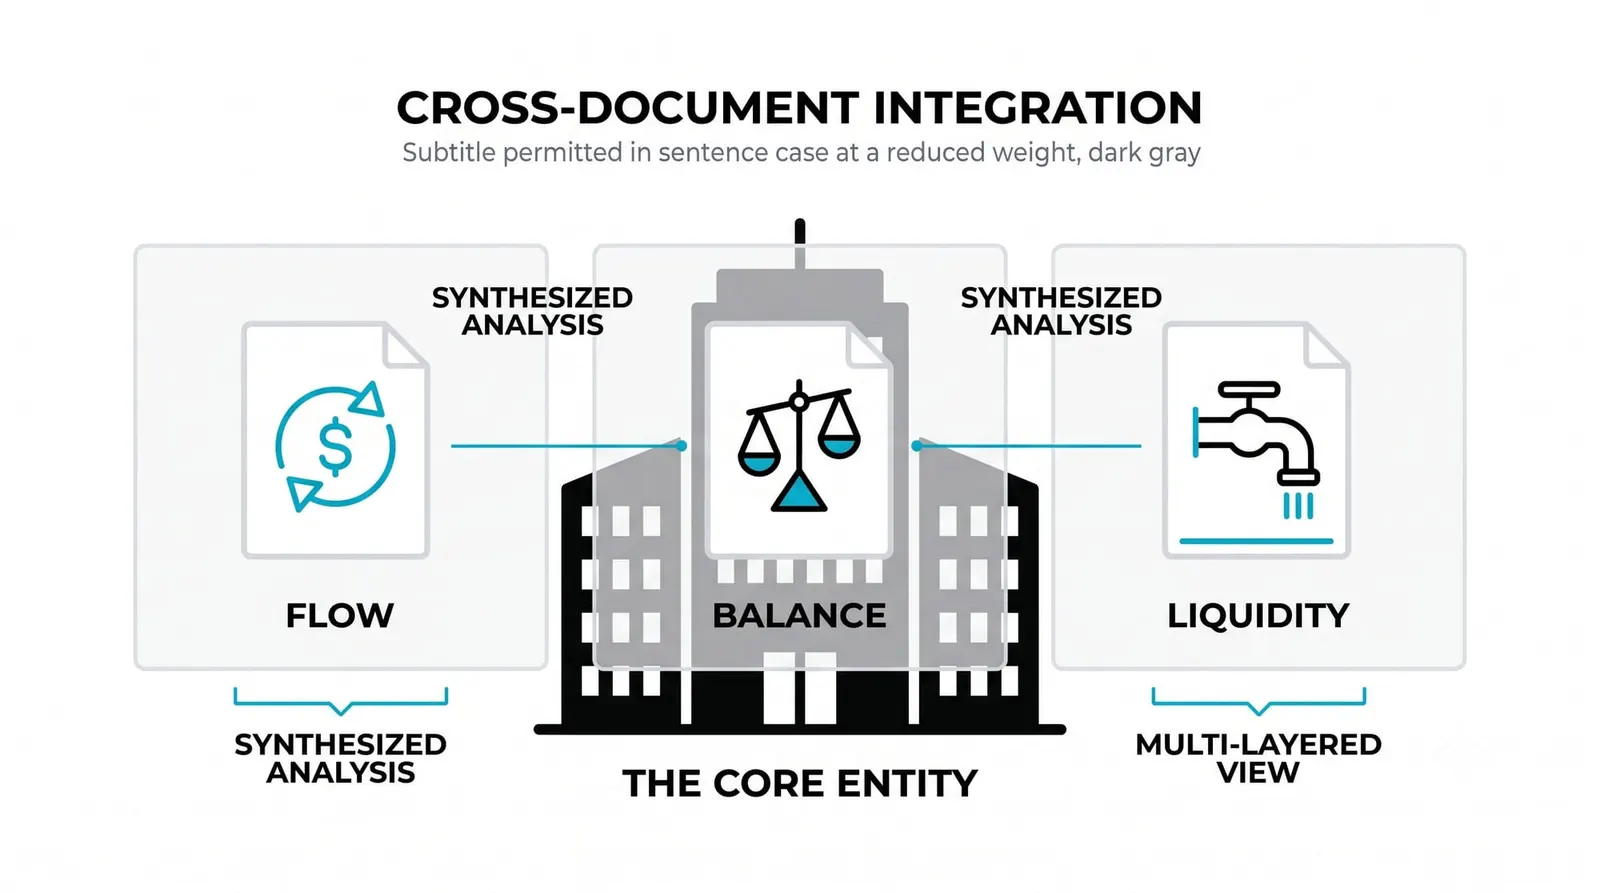
Reading one document without the others is how single-number stories fall apart. A headline profit looks impressive until you see the cash never arrived and the debt doubled. The connections are where the truth lives.
Where to Start When You Open a Report
For a first read, use this order: income statement, cash flow statement, balance sheet.
Open with the income statement to see the trend. Is revenue growing? Is profit holding up across several periods? This gives you the story of the business as a going concern.
Move to the cash flow statement next to check quality. Does operating cash flow roughly track profit over time, or does profit consistently outrun the cash? Quality of earnings lives in that comparison.
Finish with the balance sheet to judge durability. How much debt sits against the assets? Is there enough cash to absorb a bad year? A great period of profits means little if the position underneath it is fragile.
This order works because it moves from story, to proof, to structure. You hear the claim, you check the cash, and then you inspect the foundation.
Where the Profit Goes
Suppose a hypothetical company reports 50,000 of profit for the year. Round numbers, invented for illustration. Here is how that one figure appears across all three documents.
On the income statement, the 50,000 sits at the bottom as net profit. That page is done. It measured performance and reported a number.
On the cash flow statement, only 40,000 of that profit actually arrived as cash, because 10,000 of the year's sales are still owed by customers. Operating cash flow starts at 50,000, subtracts the 10,000 tied up in unpaid invoices, and lands at 40,000. Then, in the financing section, 20,000 flows out as dividends paid to shareholders. Cash for the year rises by 20,000.
On the balance sheet, everything lands somewhere. Cash is up 20,000. The 10,000 customers still owe sits in assets as receivables. In equity, retained earnings rise by 30,000: the 50,000 of profit minus the 20,000 paid out as dividends. Assets up 30,000 in total, equity up 30,000. The equation holds.
One reality, three angles. The income statement says the company earned 50,000. The cash flow statement says only 40,000 showed up and 20,000 left the door. The balance sheet says the owners' stake grew by 30,000. Every figure is true, and none of them alone is the full truth.
| Document | What It Measures | The Question It Answers |
|---|---|---|
| The income statement | Revenue minus expenses over a period | Did the business earn more than it spent? |
| The balance sheet | Assets, liabilities, and equity on one date | What does the company own and owe right now? |
| The cash flow statement | Actual cash in and out, by activity | Where did the money really come from and go? |
| The connections between them | Profit into equity, cash change explained, shared items like depreciation | Do the three pages tell one consistent story? |
The Three Statements, Answered
Which financial statement matters most?
No single one does, because each measures something the others cannot. If forced to pick for a quick quality check, many analysts reach for the cash flow statement first, since cash is hardest to dress up with accounting choices. But the correct habit is reading all three together.
Why do companies report quarterly and annually?
Public companies are required to report on a regular schedule so investors get timely, comparable information. Quarterly reports give frequent updates on progress. Annual reports are the fuller, audited version with more detail and context. The rhythm exists so that no one has to wait years to find out what happened.
Are the three statements independent of each other?
No. They are built from the same underlying records and linked by design. Profit flows into equity, the cash flow statement explains the change in the cash balance, and items like depreciation appear in all three. If the documents did not connect, at least one of them would be wrong.
Where should a beginner start reading a report?
Start with the income statement to see the trend in revenue and profit over several periods. Then check the cash flow statement to confirm the profit turned into cash. Finish with the balance sheet to judge how much debt and how much cushion the company carries. Story, proof, structure, in that order.
Next up, each document gets its own close read. The income statement comes first: how revenue becomes profit, line by line, and where companies have room to shape the number you see at the bottom.