The Bollinger Band Squeeze, Explained
The Bollinger Band Squeeze is the market's quietest stretch becoming visible: the bands pinch to their narrowest reading in months, marking unusually low volatility and a market storing pressure for a large move. The part traders get wrong immediately is the second half of that sentence. A squeeze marks that energy is building. The squeeze itself never says which way the release goes.

Think of a coiled spring pressed steady under a hand. The compression stores force. Nothing about the coil tells you whether the hand lets go upward, downward, or holds the press longer. The spring's geometry tells you the release will be violent relative to the stillness, and that is all a squeeze tells you about price.
This lesson builds on the full breakdown of the bands, which owns the construction and the BandWidth definition; here the subject is the pinch event itself.
What Counts as a Squeeze
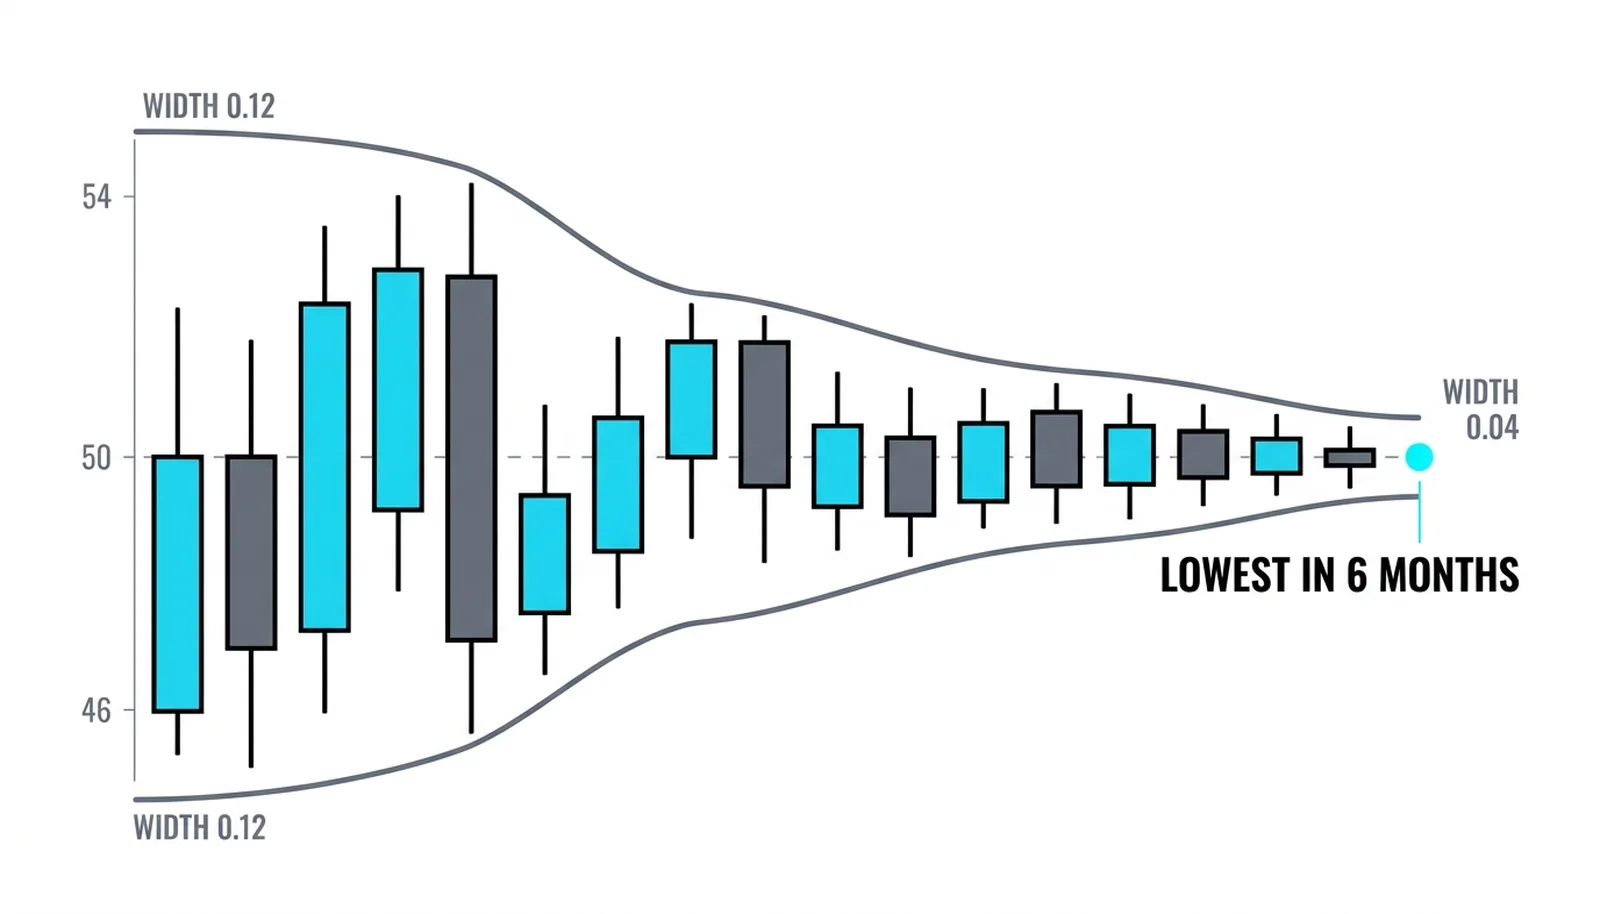
The measurement is BandWidth, the band distance divided by the middle band. A squeeze is a BandWidth reading at its lowest level in a long lookback. John Bollinger's own guidance points at the lowest bandwidth in roughly six months as the working definition. Six months is about 126 trading bars on a daily chart, long enough that the current quiet has to beat every stretch of calm the market produced over that span.
The definition is deliberately mechanical. Eyeballing a chart and deciding the bands look tight is how traders talk themselves into half-pinches. The measurement admits no debate: either the current reading is the lowest in the lookback or it is not. Most charting platforms can rank or scan that number directly, which turns squeeze-hunting from an art into a query.
Why Quiet Precedes Loud
Volatility clusters. Calm stretches follow calm stretches, and turbulent stretches follow turbulence, which is exactly why the quiet window is meaningful rather than random. Within that clustering, contraction in one window raises the odds of expansion in the next. Options markets feel the same gravity: premium shrinks through quiet stretches, and traders who sell premium are, in effect, betting that volatility returns toward its average, not that it stays pinned at the floor.
The honest framing is an odds shift, not a schedule. A squeeze loads the spring. It does not set a date for the release, and it does not pick the direction. What the historical record supports is narrower: large expansions tend to be visible in hindsight as departures from pinch points, and a market that has just printed its calmest stretch in months is statistically more likely to produce a large move soon than a market in the middle of a turbulence stretch. More likely, not certain, and soon means soon in the timeline of volatility, not a countdown you can trade against by the hour.
Reading the Pinch Without Fooling Yourself
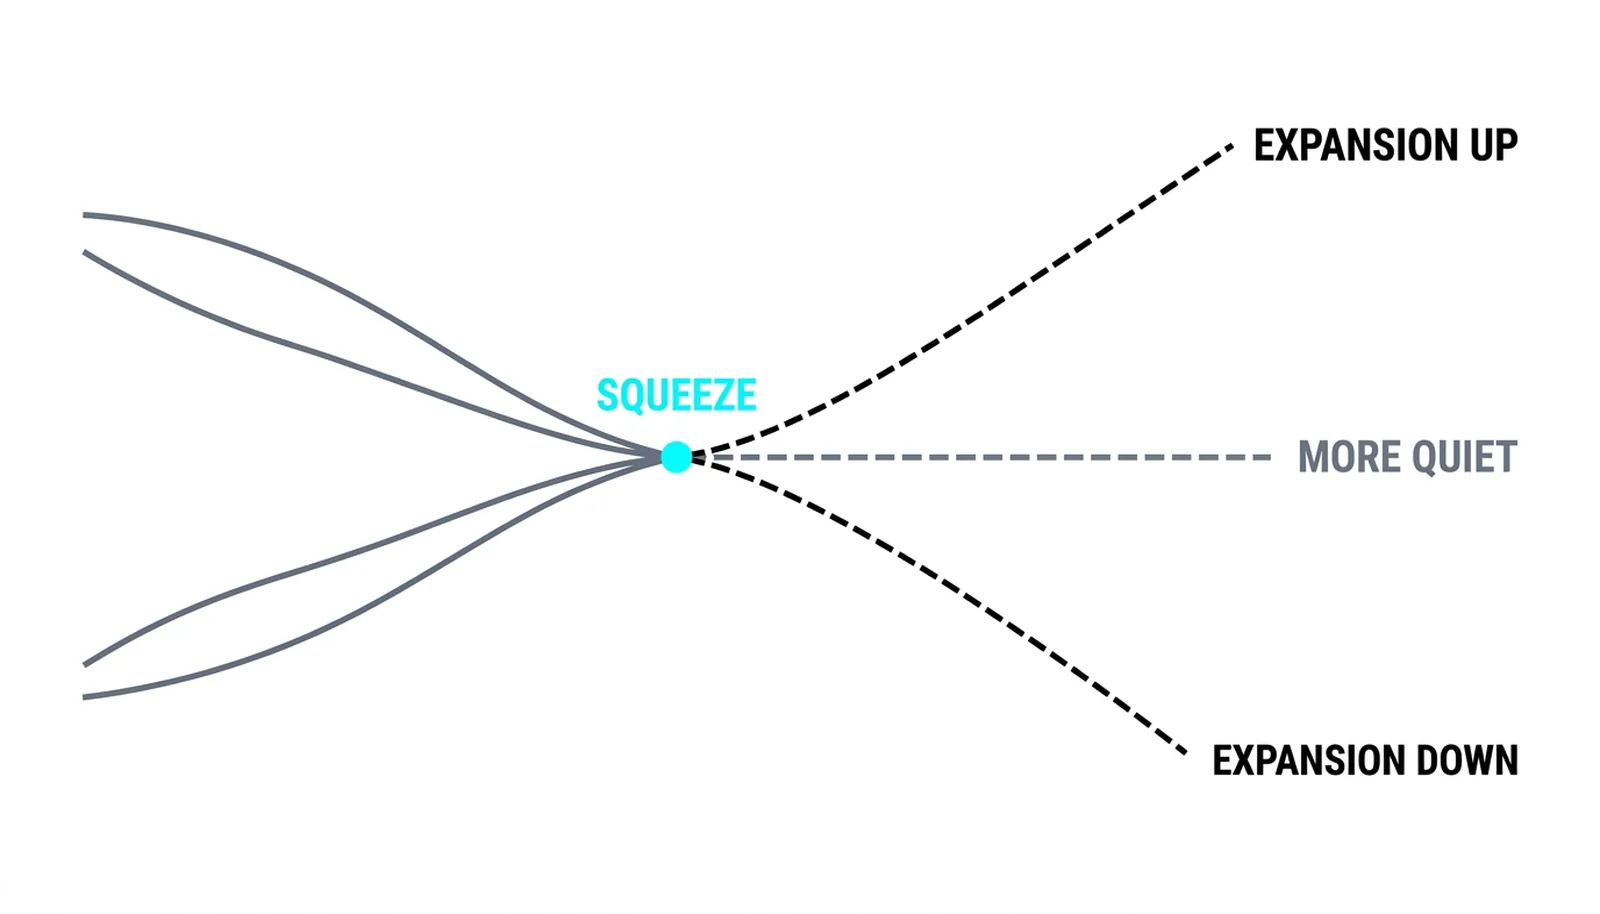
The squeeze says when, never which way. Three exits exist from every squeeze, and only two of them are trades: expansion upward, expansion downward, or more quiet. The third outcome is common enough to plan for, because low volatility can persist far longer than any trader's patience.
Two traps deserve names. The first is the false break, one bar that closes outside a band and snaps straight back inside; the breakout lesson owns that failure mode in detail. The second is duration worship, the belief that a longer squeeze guarantees a bigger move. Day trading practice says the opposite from its own screen time: single-session compressions have produced bigger moves than month-long ones, and duration gets treated as untradeable information.
One honest detail from the options side, because it explains who is trading against the pinch: implied-volatility traders often sell premium when the bands sit historically far apart and buy it when the bands sit historically close, both bets on volatility reverting toward its own average. That flow is one reason pinches resolve violently; the quiet is itself a priced position.
Scanning for Squeezes Like a Professional
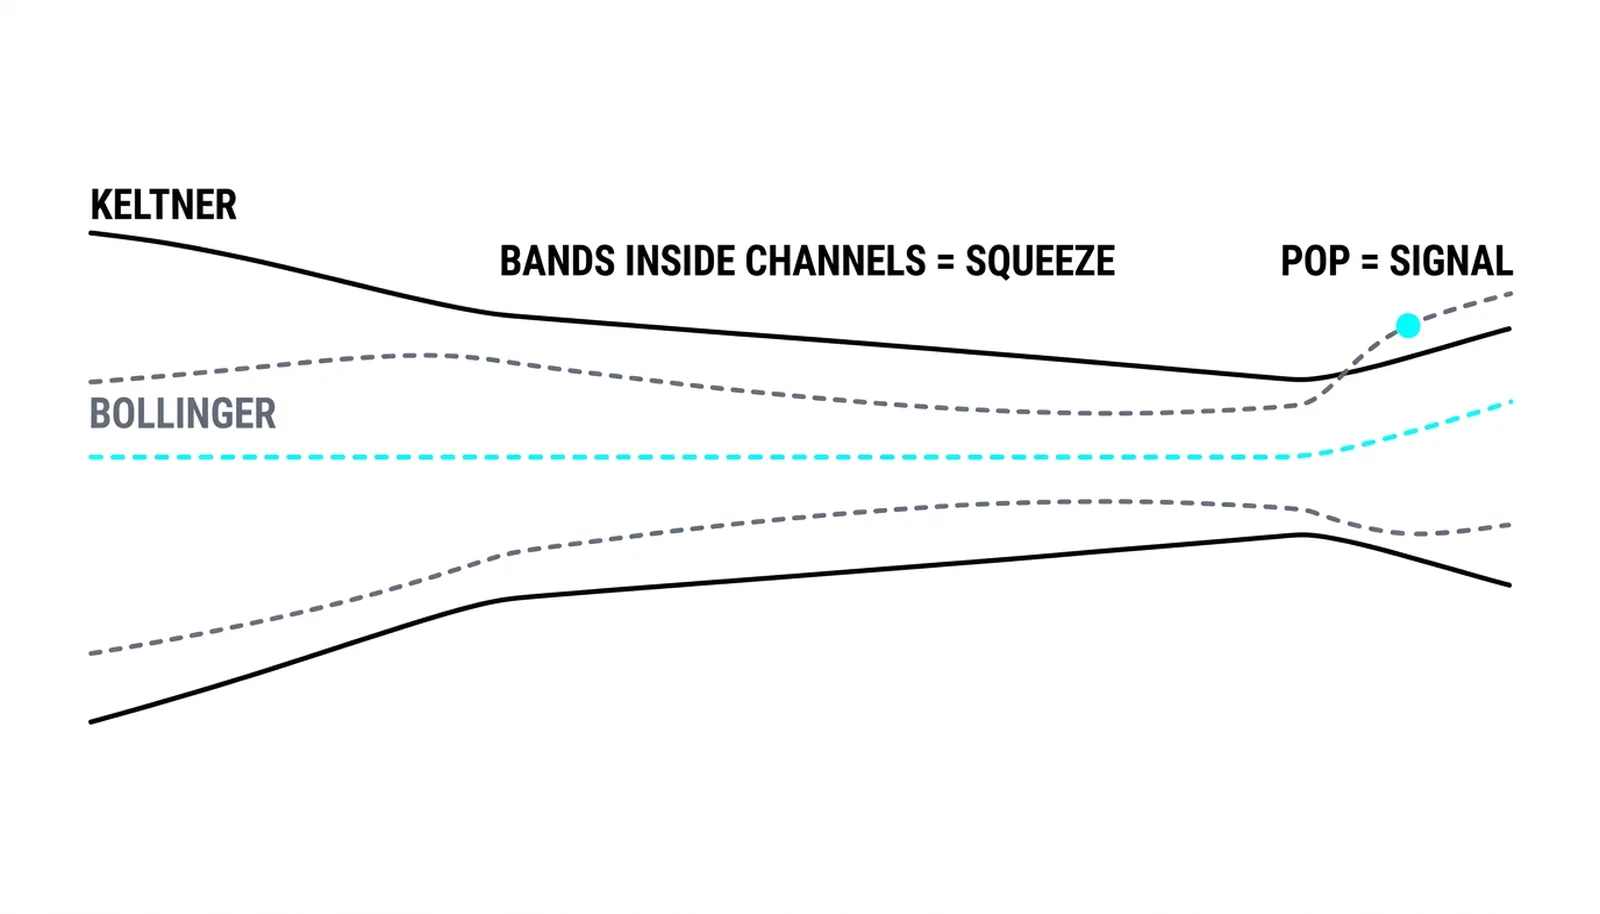
The screen has four steps, and every one is a measurement rather than an opinion. Rank the universe by BandWidth percentile and keep only readings near the floor of their own lookback. Flag the ones where the current reading is the lowest in roughly six months. Add the day trading framework's confirmation: the squeeze, in that definition, is the Bollinger Bands trading inside Keltner Channels, the bands at 20 and 2, the channels at 20 and 1.5 times average true range, because standard deviation falling inside the average true range marks extreme quiet by two different measures at once. The trade signal fires when the bands pop back outside the channels, with a momentum oscillator choosing direction. The claimed 87 percent continuation odds when a squeeze fires with the trend come from the day trading framework's own backtests, so treat them as that framework's evidence rather than a universal constant. One day trading rule worth remembering on time frames: never fight the direction of the five-minute squeeze.
Keltner Channels and average true range get full lessons later in this level, so they stay name-checked here. Direction, once expansion starts, gets read from price and filters rather than from the pinch itself; the ADX lesson covers the trend-strength read that separates expansion worth trading from noise. The blunt line stands regardless of the confirmation stack: a squeeze is a watchlist event, not a trade. The trade arrives when expansion arrives, and the breakout lesson covers that moment.
One Pinch, Measured
Round numbers, all hypothetical. A market trades near 50. Its 20-bar standard deviation sits at 0.5, so the bands run from 48 to 52, a band distance of 2. BandWidth is 2 over 50, which is 0.04.
Last quarter the same market ran a 20-bar standard deviation near 1.5 on a similar average, a band distance of 6 and BandWidth of 0.12. Today's reading of 0.04 is a third of that norm and the lowest print on the whole six-month window. The screen flags the squeeze.
Five sessions later, the standard deviation has tripled. The bands run from 42.5 to 57.5, and BandWidth prints 0.15, well beyond the old norm. The expansion has started. Note what the squeeze contributed: the alert, the watchlist entry, the readiness. Direction came from price, which closed above the upper band with the trend filter agreeing, and the position got its proof from the expansion itself, never from the pinch.
| BandWidth state | What it says about the volatility cycle | The practical response |
|---|---|---|
| Lowest in six months | A textbook squeeze; energy stored, odds of expansion rising | Watchlist, alerts set, no position yet |
| Rising off the floor | Expansion has begun; the market is choosing a direction | Read direction from price and filters, not from the squeeze |
| Mid-range | Ordinary conditions; no information either way | Trade the regime you see, skip the drama |
| Extreme high | Turbulence stretch; historically, quiet eventually returns | Expect the width cycle to turn eventually; do not predict the date |
Bollinger Band Squeeze, Answered
What is a Bollinger Band squeeze?
A stretch where the bands pinch to their narrowest in a defined lookback, conventionally the lowest BandWidth reading in about six months. It marks unusually low volatility and a market storing pressure for a large move, without saying anything about the direction of that move.
How do I find squeeze setups?
Measure rather than eyeball. Rank candidates by BandWidth, flag readings at the floor of their lookback window, and add the Keltner Channel containment check for confirmation: bands inside the channels at 20 and 2 versus 20 and 1.5 marks quiet confirmed by a second volatility measure. Then wait for expansion instead of predicting it.
Does a squeeze tell you the direction?
No. Three exits exist from every squeeze: up, down, or more quiet. Direction comes from price after the release, read through closes outside the bands, trend filters, and momentum agreement. Any setup that pretends the pinch itself picks a side is guessing with extra steps.
What is the Keltner Channel confirmation?
The day trading framework defines the squeeze as the Bollinger Bands trading inside the Keltner Channels, which compares standard deviation against average true range. When the bands sit inside the channels, both measures agree the market is extremely quiet. His signal fires when the bands pop back outside, with a momentum oscillator choosing the direction.