Multi-Day VWAP: Weekly and Monthly Levels
Multi-day VWAP is the same volume-weighted average you already know, rolled across a longer window: the weekly form averages every trade in the current week, the monthly form averages every trade in the current month, and both exist because institutions benchmark swing and position fills against those wider windows exactly the way day desks benchmark against the daily line. A day trader asks whether the session's business happened above or below value. A swing desk asks the same question about the week. A position book asks it about the month.

The earlier lessons in this block treated the daily line as the session's value reference and covered how price behaves around it intraday. This lesson widens the window and changes nothing else about the math. Think of a utility bill: the monthly average smooths one afternoon of blasting the air conditioner, and the weekly and monthly VWAPs smooth one wild session the same way. A single violent day barely dents the monthly line. That is the point.
The Weekly Line and the Monthly Line
The weekly VWAP is the volume-weighted average price across the current trading week, resetting each Monday. It answers the swing trader's core question: is this week's business getting done at prices above or below the week's value? When price holds above the weekly line, the week's buyers are in profit on average, and dips tend to find sponsorship. When price trades below it, the average participant this week is underwater, and rallies meet supply from people wanting out at breakeven.
The monthly VWAP is the position trader's version. It resets on the first session of the month, moves slowly, and runs flatter than anything shorter. Longer-term money measures fills against it because a fund accumulating over weeks cares whether it paid better or worse than the month's average, not whether it beat Tuesday's line. Volume price analysis makes the same underlying point from a different angle: sustained moves need volume agreement across timeframes, and the monthly VWAP is where that agreement shows up as a single line.
The two lines behave differently by construction. The weekly line reacts within days because five sessions is a small sample. The monthly line barely notices a single session, good or bad. That difference is a feature. The weekly line tells you about the current campaign; the monthly line tells you about the regime.
Who watches which line matters more than the lines themselves. Swing traders with three-to-ten-day holds live on the weekly. Position traders and funds live on the monthly. When both groups see the same picture, their orders stack in the same direction, and that stacking is what gives the multi-day lines their weight.
The Alignment Filter
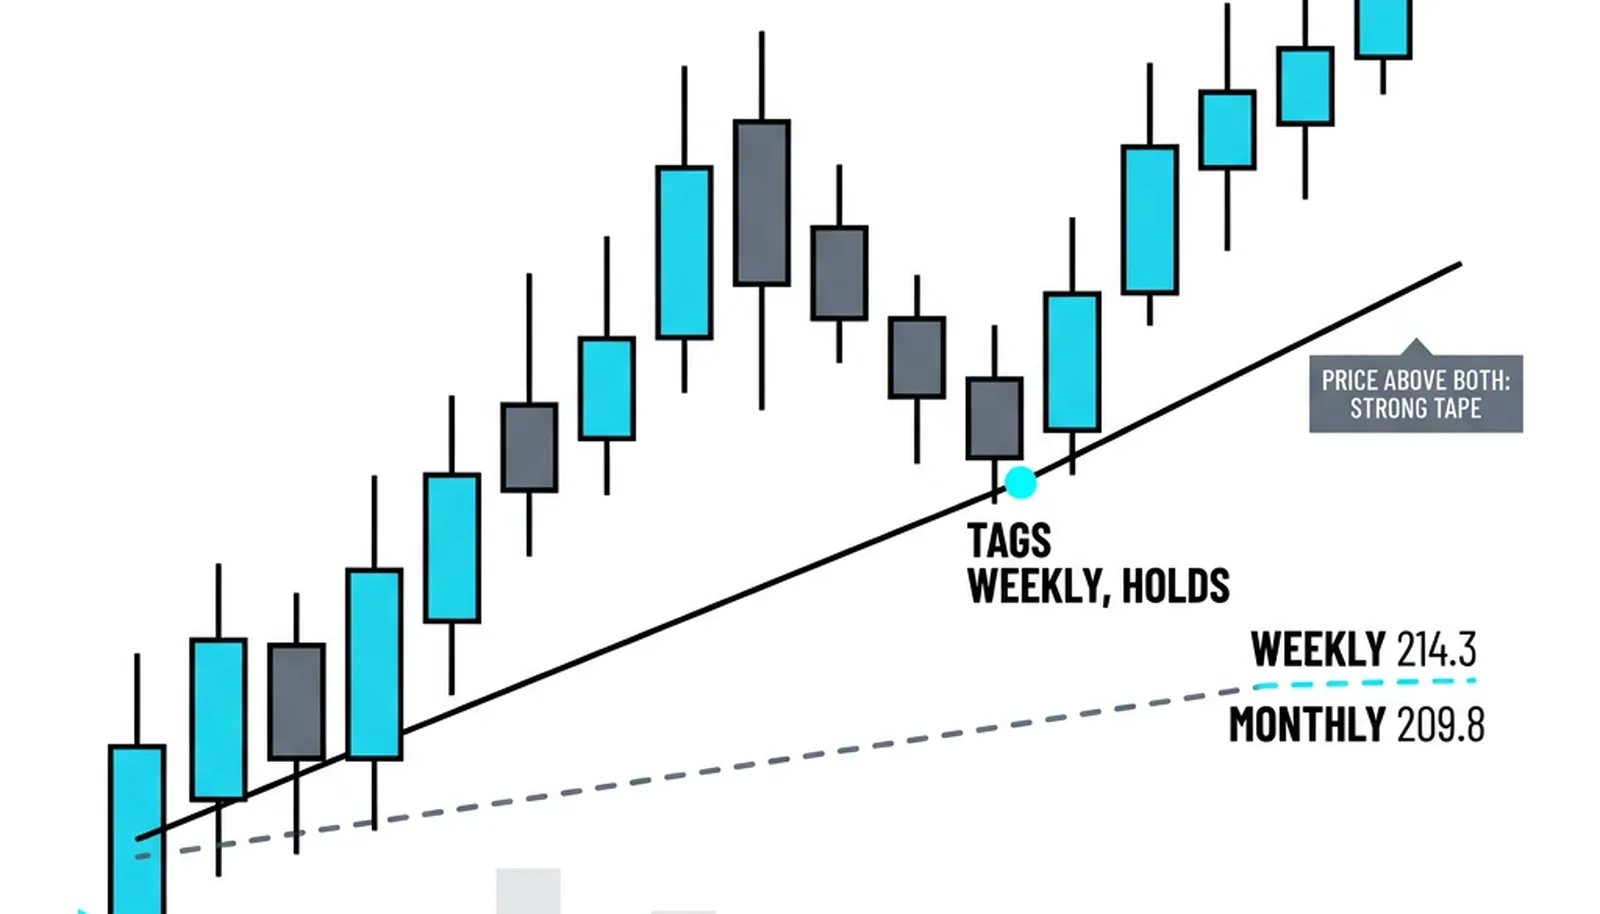
The fastest use of the two lines is a three-state filter. Price above both the weekly and monthly VWAP is a strong tape: the week's business and the month's business are both happening above value, and longs have the wind at their back. Pullbacks into the weekly line in this state are the highest-quality swing entries the setup offers.
Price between the two lines is a transition tape. The week has turned against the month, or the month has not yet confirmed the week. Trades get harder here because the two constituencies disagree: one group is averaging down or defending, the other is taking profit or pressing. Expect chop, failed follow-through, and lines that get crossed without meaning much. Reduce size or stand aside until price picks a side.
Price below both lines is a weak tape. The average participant this week and this month is underwater, rallies are exit opportunities for trapped longs, and shorts carry the edge. The weekly line flips from support to resistance in this state, and rallies into it are where shorts reload.
- Above both: strong tape, buy pullbacks to the weekly line, trail with the week.
- Between: transition tape, expect conflict, cut size, demand more confirmation.
- Below both: weak tape, sell rallies into the weekly line, treat bounces as suspect.
The filter does not predict. It grades the tape you are standing in, which is enough to keep you from buying strength in a weak regime or shorting dips in a strong one.
Gaps and Catch-Up
An earnings gap re-prices the weekly average faster than most traders expect. The gap itself does the work: a stock that opens eight points higher on heavy volume has just transacted a large share of the week's business at the new price, and the weekly VWAP, being volume-weighted, climbs toward that price over the following sessions. The line does not jump to the gap. It migrates, session by session, as more volume confirms the new level.
The monthly line barely moves on a gap. One heavy day in a twenty-plus-session window shifts it only slightly. This creates a common pattern after a big gap: price well above the monthly line, the weekly line rising underneath, and the alignment filter reading strong within days even though the monthly reference lags far behind. That is normal, not a flaw.
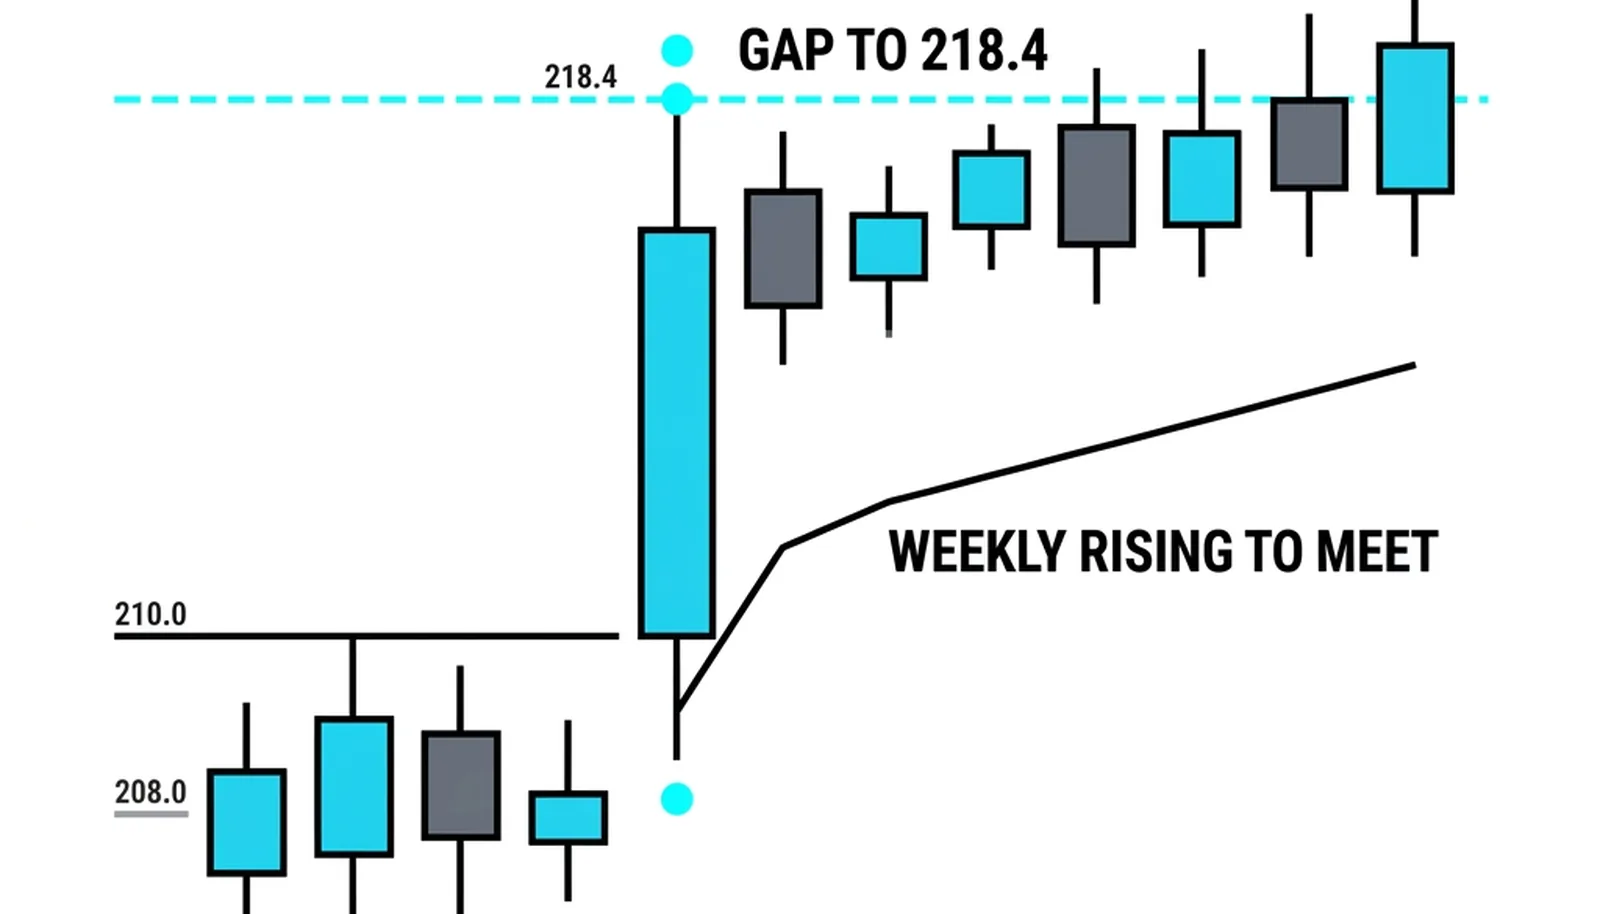
The behavior at the weekly line after a gap is the real test. A pullback that tags the rising weekly VWAP and holds on shrinking volume says the week's new value is being accepted; the gap was re-pricing, not exhaustion. That tag-and-hold is the swing entry signal this block keeps returning to, now on the wider window.
The warning version is the weekly line sliced on expanding volume. When price cuts through the week's average with participation growing, the week's value itself is shifting, and the gap's re-pricing is being rejected. One close below the line on light volume can be noise. A drive through it on heavy volume is the market arguing against the new level.
The Week at 214.30
A hypothetical stock finishes last week with a weekly VWAP of 214.30 and a monthly VWAP of 209.80. Price closed the week above both lines, so the alignment filter reads strong heading into the new week.
Monday, the stock gaps up on earnings to 218.40 and trades heavy volume all session. The weekly VWAP resets at the open and starts building from the new price zone. The monthly line barely twitches, grinding from 209.80 toward 210.
Through the week, heavy trade between 216 and 220 pulls the weekly VWAP up to 216.10 by midweek, while the monthly line reaches 211.20. Price stays above both. The alignment filter has read strong every session, and the weekly line is now rising underneath price like a floor being built upward.
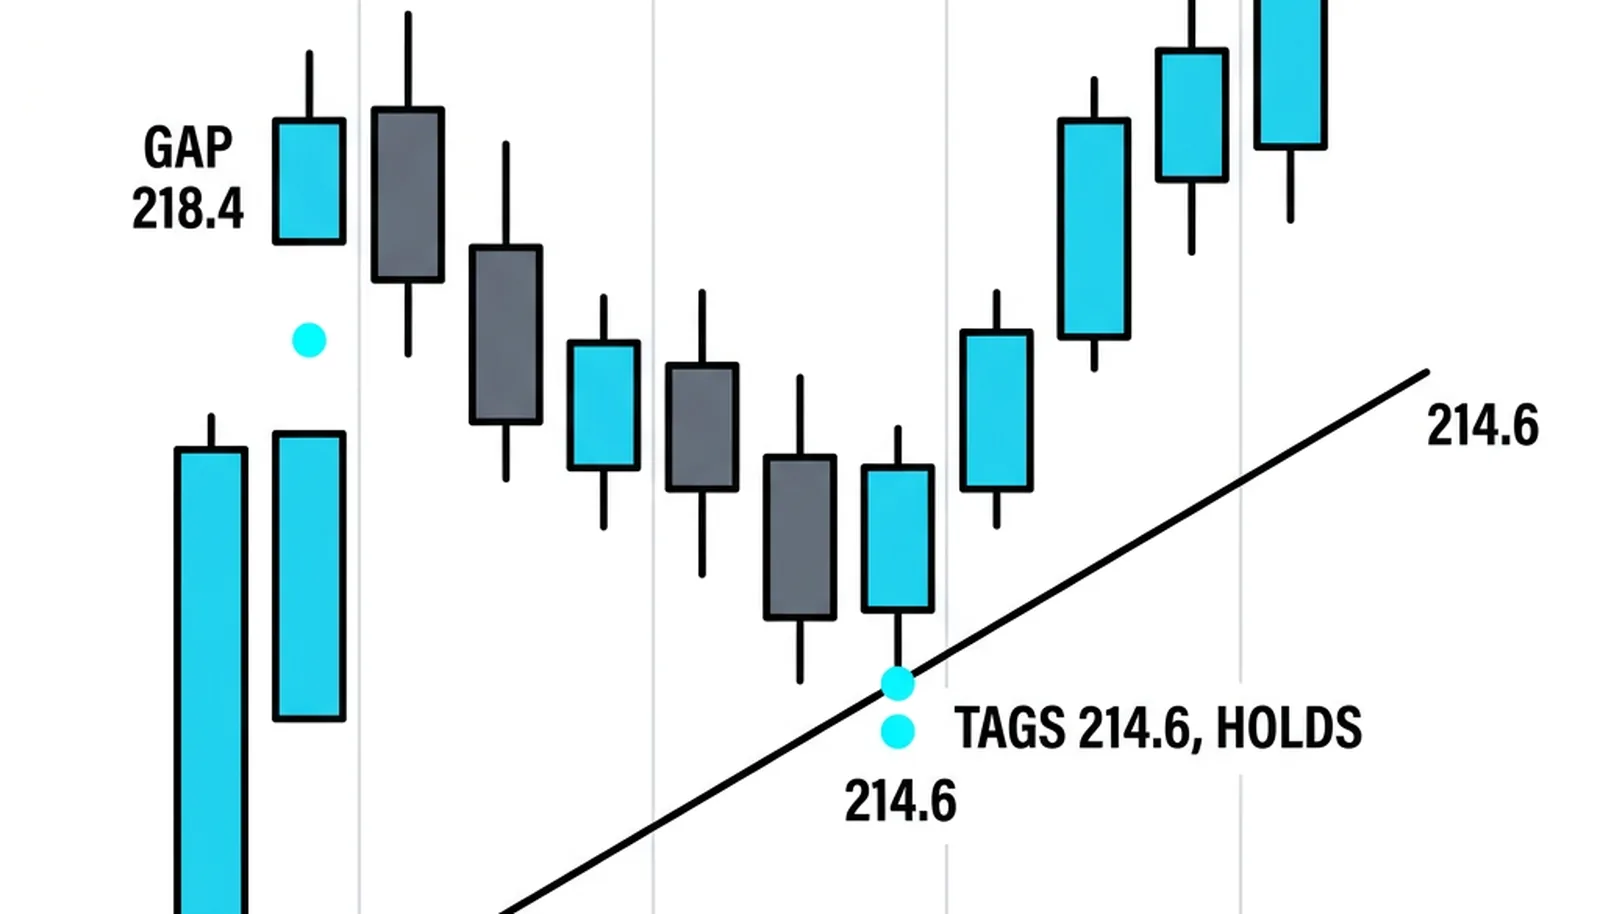
Wednesday, the stock pulls back to 214.60, tags the rising weekly VWAP area, and holds. Volume on the dip shrinks to well below the week's average. That is the textbook tag-and-hold: sellers could not push through the week's value, and the light volume says nobody was motivated to try. The stock resumes upward and reaches 221.70 by Friday. A swing trader who bought the tag at 214.60 with a stop under the weekly line rode the cleanest entry of the week.
Now the warning version. Suppose instead that Wednesday broke 214.30 and closed at 212.90 on volume heavier than Monday's gap day. The weekly line was not respected; it was sliced with expansion. The week's value is shifting downward, the gap's re-pricing is being rejected, and the alignment filter flips to between-the-lines at best. The correct response was to exit longs and wait, not to average down into a line the market just overruled.
| Window | The Line | Who Uses It | The Read |
|---|---|---|---|
| Daily | Session VWAP | Day traders, execution desks | Today's value; intraday bias and timing |
| Weekly | Five-session VWAP | Swing traders | The week's value; pullback entries and the strong/weak flip |
| Monthly | Month-to-date VWAP | Position traders, funds | The regime; slow, flat, the line big money measures against |
| Anchored | VWAP from a chosen event | All timeframes | Value since the event; covered in the anchoring lesson |
Two cautions before you lean on these lines. First, longer windows lag. The monthly VWAP is slow by design, and in a fast move it will be late to confirm and late to warn. The multi-day lines frame context; the daily line times the trade. Asking the monthly line to time an entry is asking it to do a job it was never built for.
Second, the windows are arbitrary boundaries. A week is five sessions because the clock says so, not because the market agreed to reset its memory on Monday. Treat the weekly and monthly lines as reference grades rather than exact levels. A tag within a reasonable band of the weekly line counts. Let the daily structure, the candles, and the volume decide the actual entry.
Multi-Day VWAP, Answered
What is multi-day VWAP?
Multi-day VWAP is the volume-weighted average price calculated across a window longer than one session, most commonly the current week or the current month. The math is identical to the daily version; only the reset point changes. It exists because swing and position traders benchmark their fills against wider windows than day traders do.
What is the difference between weekly and monthly VWAP?
The weekly VWAP averages the current five-session week and reacts within days, making it the swing trader's value reference. The monthly VWAP averages the whole month to date, moves slowly, runs flatter, and is the line longer-term money measures itself against. The weekly tells you about the current campaign; the monthly tells you about the regime.
How do you use weekly VWAP on a swing trade?
Start with alignment: price above both the weekly and monthly lines is a strong tape. Then wait for a pullback that tags the rising weekly line on shrinking volume and holds; that tag-and-hold is the entry, with a stop below the line. If price slices the weekly line on expanding volume instead, stand down, because the week's value is shifting against the trade.
Why did the weekly VWAP move after the earnings gap?
Because the gap traded heavy volume at the new price, and VWAP weights by volume. The heavy post-gap sessions pulled the weekly average up toward the new level over the following days, from 214.30 to 216.10 in the example. The line migrates toward wherever the week's business is actually getting done.
The next lesson takes the same idea off the clock entirely: anchoring VWAP to a specific event, an earnings bar, a breakout, a low, so the line measures value from the moment that mattered rather than from an arbitrary Monday.