Mean Reversion or Trend Following?
Mean reversion and trend following are the two modes every market alternates between, and the first question on any chart is which one is paying right now. Reversion pays the trader who fades stretched moves back to value. Trend following pays the trader who joins a move and holds it. The same chart can reward opposite trades on different weeks, so knowing which mode the market is in matters more than which camp a trader prefers.

Think of a cyclist's cadence: the road decides the gear, spinning the wrong gear uphill wastes the legs and grinding the wrong gear on the flats burns the knees, and the skill is reading the terrain quickly. Markets work the same way. A fade that was free money in a bracket is a donation in a trend.
Every fade in this block assumed a rotating market. This lesson is the mode test that decides whether any of those setups applies today.
The Mode Tests
Four pieces of evidence separate the modes, in order of reliability. Read them top down and let the strongest one lead.
Acceptance and rejection. Price that leaves value and builds trade at the new level is trending. Price that leaves value and gets rejected back inside is rotating. This is the last lesson's test promoted to a regime detector. One probe beyond the edge means little. Several bars holding beyond it, with volume, means the market accepted new prices.
Auction structure. Market profile theory describes the one-timeframe day: each period auctions higher than the last without any counter-auction, and that is trend by definition. The companion concept in market profile theory is range extension beyond the opening balance. When price breaks out of the early range and never comes back, rotation broke. A bracket shows the opposite shape: periods overlapping, both sides trading the same prices.
Indicator confirmation. A trend-strength reading such as ADX rising through its threshold corroborates what the tape already showed. An earlier lesson covered the indicator's mechanics, so the short version here is enough: rising strength plus directional movement supports the trend read, flat strength supports the rotation read. Indicators confirm. They do not decide.
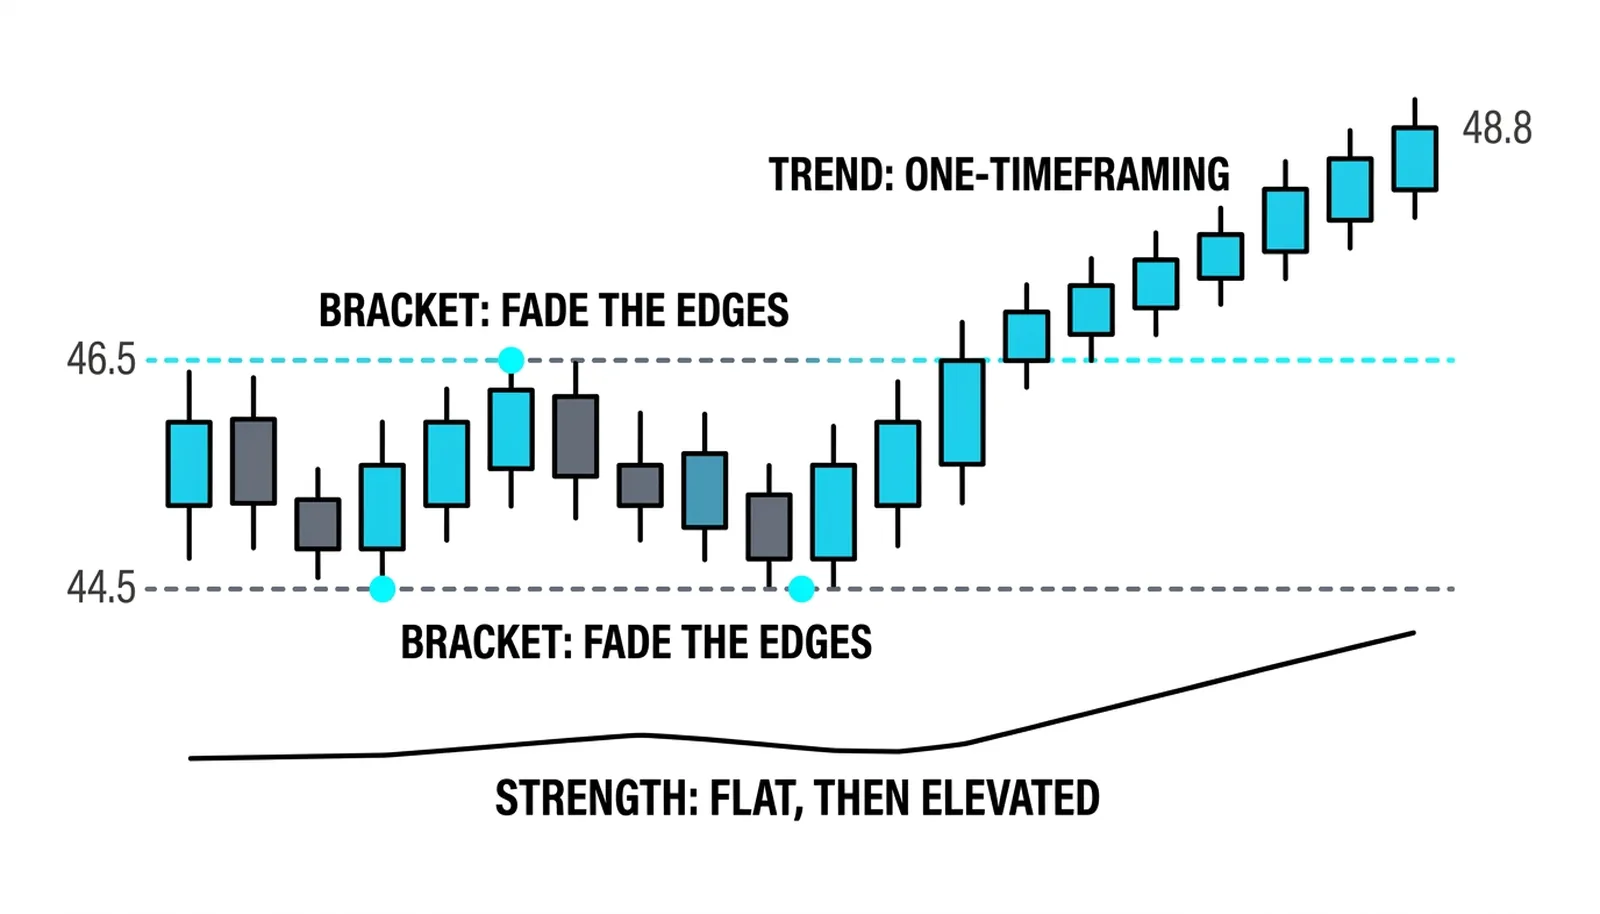
Reversion speed. Quantitative backtesting practice uses the half-life idea to measure how fast a market actually reverts to its mean. A market whose reversion speed has stretched beyond the trader's holding horizon should be traded as a trend, or not traded at all. The full quantitative treatment waits in Level 10. For now the takeaway is simple: mean reversion is not a belief, it is a measurable property that can speed up, slow down, or vanish.
When Modes Die
Regimes end. Sometimes they end permanently.
Quantitative backtesting research has documented pairs that mean-reverted beautifully for years, until 2008, and then never worked again. The statistical relationship did not bend. It broke. A trader who kept fading on the old evidence was trading a market that no longer existed.
So a mode call needs re-earning. Last month's behavior is evidence, not a promise. Practical habits that keep the call honest:
- Re-test the mode at a fixed interval, weekly at minimum.
- Track whether fades are paying or bleeding over the last handful of attempts.
- Shrink size when the evidence turns mixed instead of arguing with it.
- Treat every mode call as provisional, with a date on it.
The market owes no trader continuity. A mode that paid for a year can stop paying tomorrow, and the only protection is noticing early.
The Transition Trap
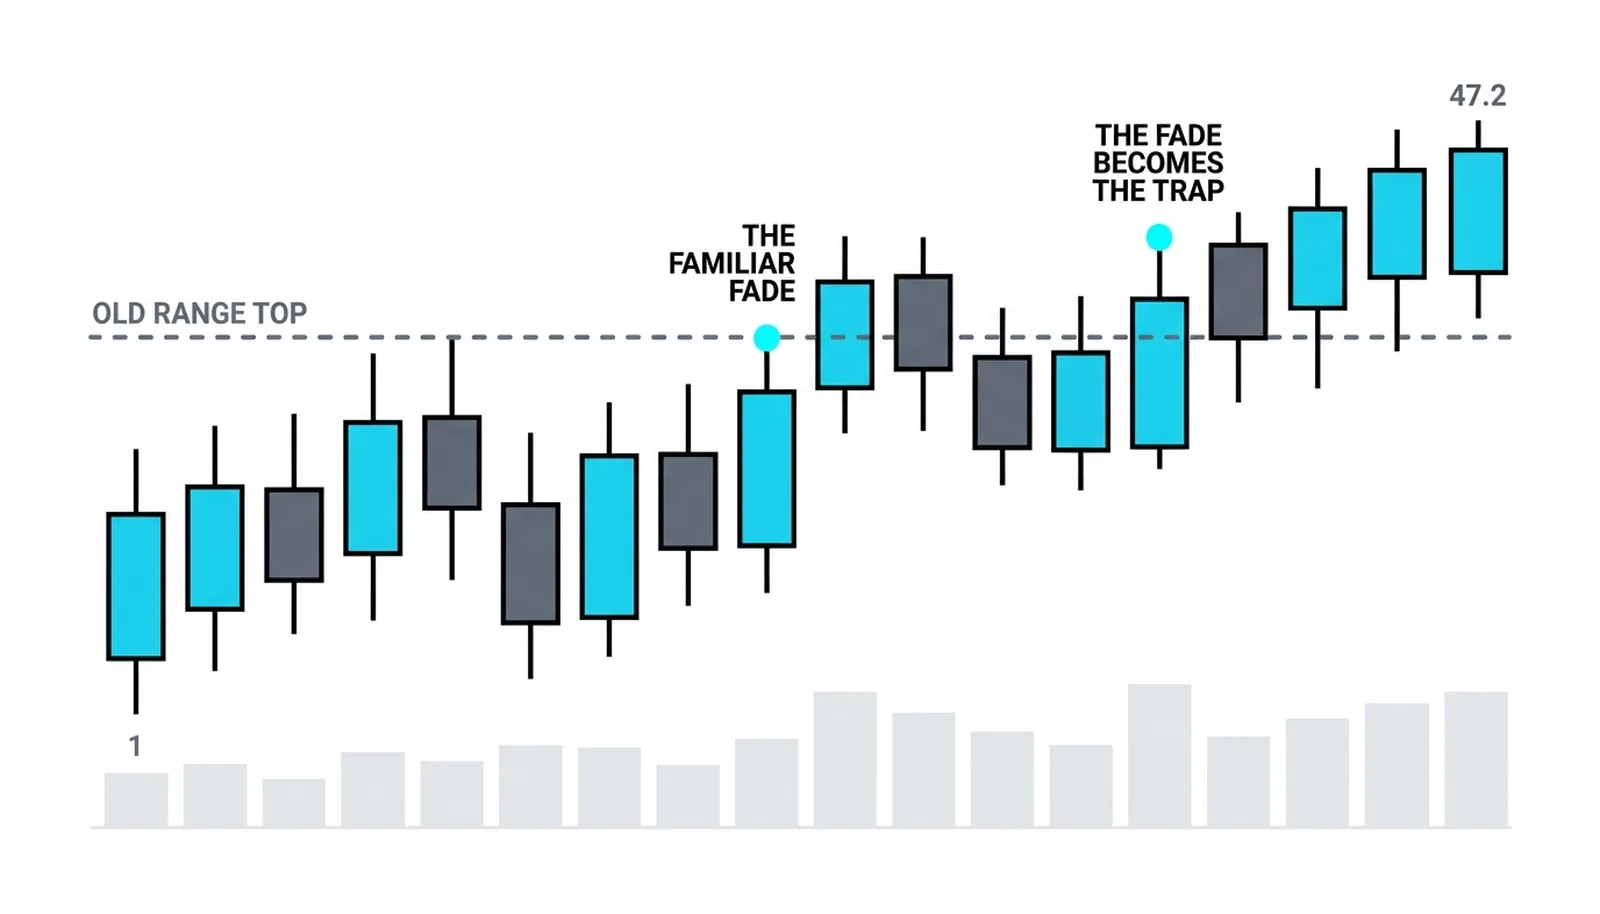
The seam between modes is where accounts bleed. The last bars of a trend feel like a fresh trend. The first bars of a bracket feel like a pullback worth buying. Both reads are wrong, and both feel right.
The price action framework warns against leaning on a single lagging filter, such as a moving-average slope, to make the mode call. Lag makes the signal latest exactly when it matters most. By the time a slope rolls over, the trend trader has already given back the open profit, and by the time it turns up, the fade trader has already been run over twice.
The fix is ordering. Read structure and acceptance first, because they update in real time. Let indicators confirm afterward. A trader watching one-timeframing and range extension sees the transition as it happens. A trader watching a lagging average sees it after the expensive part.
One more discipline helps at the seam: when the evidence conflicts, stand down. Mixed signals are themselves a signal, and the trade they justify is no trade.
The Same Chart, Two Weeks Apart
A hypothetical stock spends week one rotating between 44.50 and 46.50, with value holding above 45.00. The trader fades the edges twice. Both fades pay. The bracket is clean, volume is ordinary, and every probe beyond an edge gets rejected within a bar or two.
Week two opens identically. Same range, same edges. Then the third test of 46.50 behaves differently: price extends to 47.20 and builds trade there for four consecutive bars on expanding volume. No counter-auction appears. Nothing pulls price back inside the old range.
The trader takes the same fade that paid twice last week. This time there is no rejection. The position runs to a 47.90 stop-out while the market one-timeframes up to 48.80. The setup was identical. The mode was not.
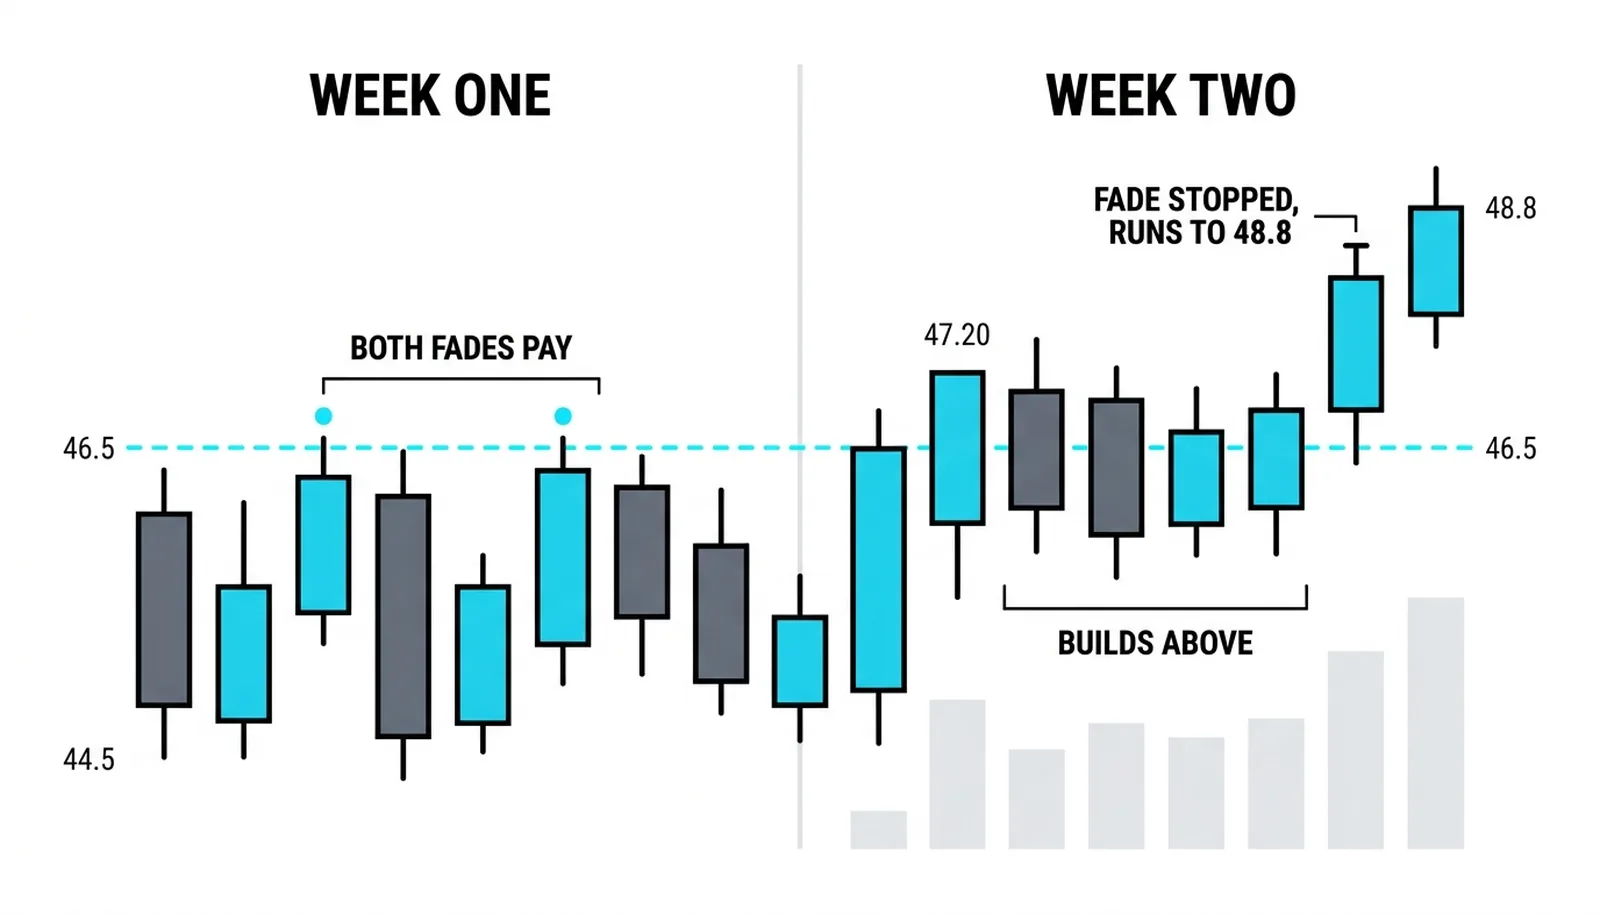
The tells were all visible before the stop was hit:
| Observation | Bracket read | Trend read | The action |
|---|---|---|---|
| Price holds above 46.50 for four bars | Overdue to rotate back | Acceptance at new prices | Skip the fade, wait |
| Volume expands at 47.20 | Climax, about to fade | New buyers committing | Stand aside or join |
| No counter-auction all session | One-sided excess | One-timeframing, trend day | Do not fade strength |
| Range extension never revisited | Gap to fill later | Rotation has broken | Trade with the break |
Same chart, same levels, opposite correct trade. The only thing that changed was the mode, and the mode was announced by acceptance, structure, and volume before the damage was done.
Mean Reversion or Trend Following, Answered
How do you tell if a market is trending or ranging?
Watch what price does at the edges of value. Acceptance beyond the edge, one-timeframing, and range extension that holds say trend. Rejection back inside and overlapping periods say range. Confirm with a trend-strength reading, never decide from one.
Can a market be in both modes at once?
Yes, across timeframes. A daily chart can trend while the hourly chart rotates inside that trend. The mode call applies to the timeframe being traded, so a trader fading the hourly rotation inside a daily uptrend is a reversion trader with the wind at their back.
What happens if the mode flips mid trade?
The original reason for the trade is gone, so the trade is gone. A fade entered on a rotation read has no justification once acceptance appears beyond the edge. Exit at the stop or earlier, and reassess under the new mode rather than converting a failed fade into a hopeful hold.
Which strategy makes more money?
Neither, in isolation. Each pays during its own regime and gives back during the other. The durable edge belongs to the trader who reads the mode correctly and switches, not to the trader who marries one style.
Level 9 closes here. Next the course moves into Level 10, where the quantitative layer takes over: measuring reversion speed, testing whether a pattern ever had an edge, and putting numbers under everything the chart has been saying in plain language.