Timeframes on a Chart
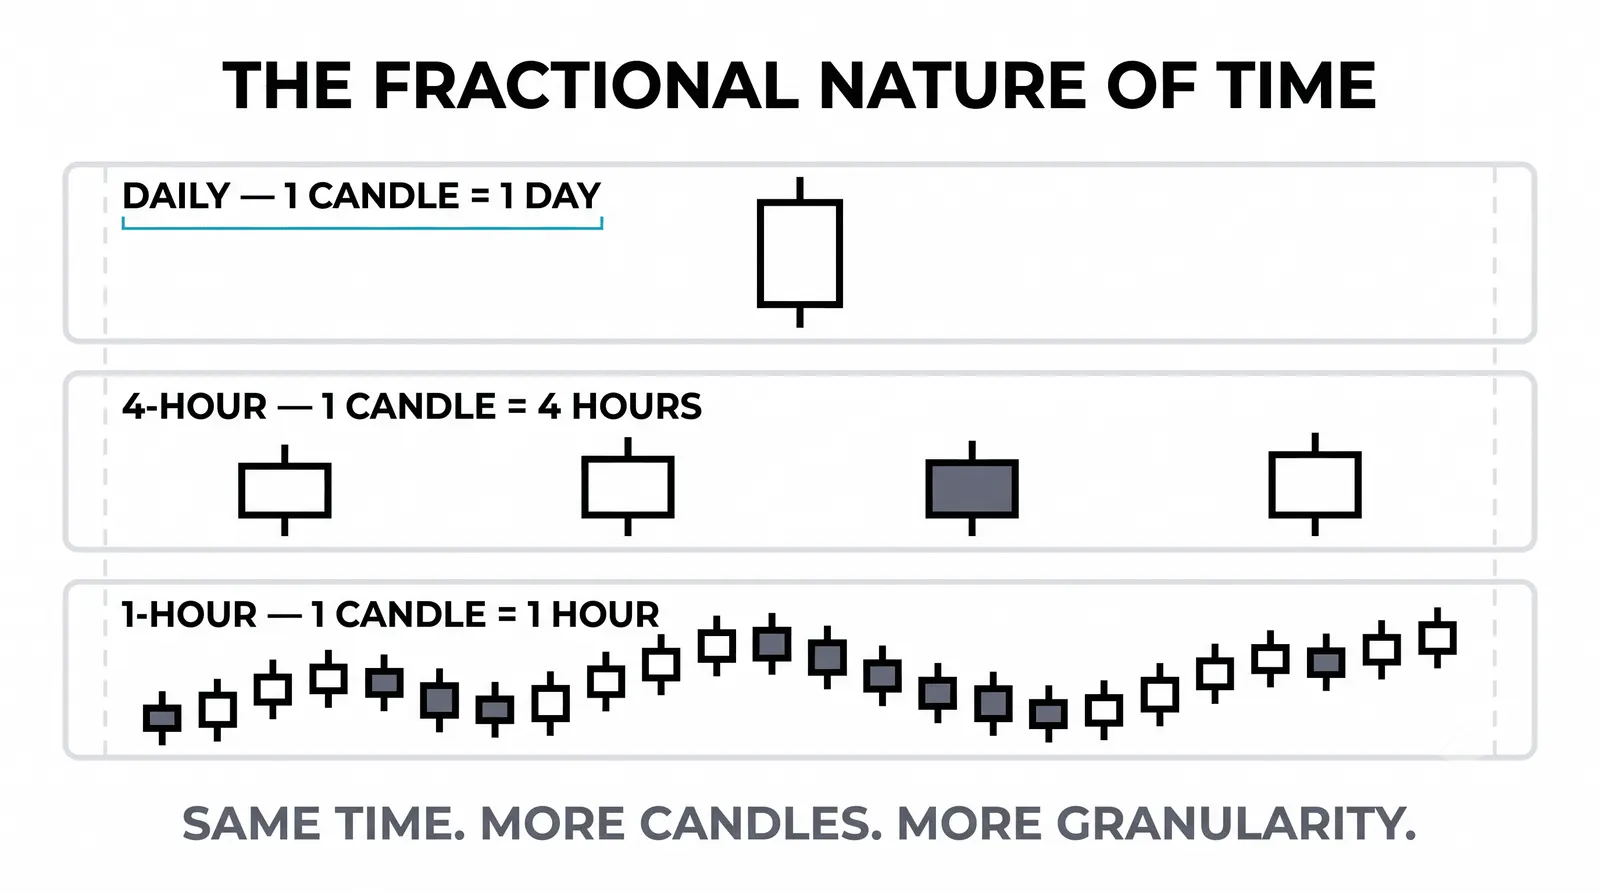
Timeframes on a chart are simply how much real time each bar or candle represents. A 5-minute chart packs five minutes of trading into one candle. A daily chart packs a full day into one. Nothing about the market changes when you switch timeframes. Only the compression changes.

Think of timeframes as zoom levels on a map: street level, city level, country level, same world, different useful detail. Nothing fancier than that. The rest of this lesson is about what each zoom level shows you, who uses which, and how to pick one without overthinking it.
What a Timeframe Actually Is
Every candle on your chart is a container. It holds the open, high, low, and close of a fixed slice of time. On a 1-hour chart, each candle holds one hour of trading. On a weekly chart, each candle holds a full week.
Switching from a 15-minute chart to a daily chart does not change a single trade that happened. It changes how those trades are grouped and displayed. The same price data gets sliced thicker or thinner.
This matters because traders often talk as if different timeframes show different markets. They do not. They show the same market at different resolutions, and each resolution answers a different question.
The Same Market Looks Like a Different Animal
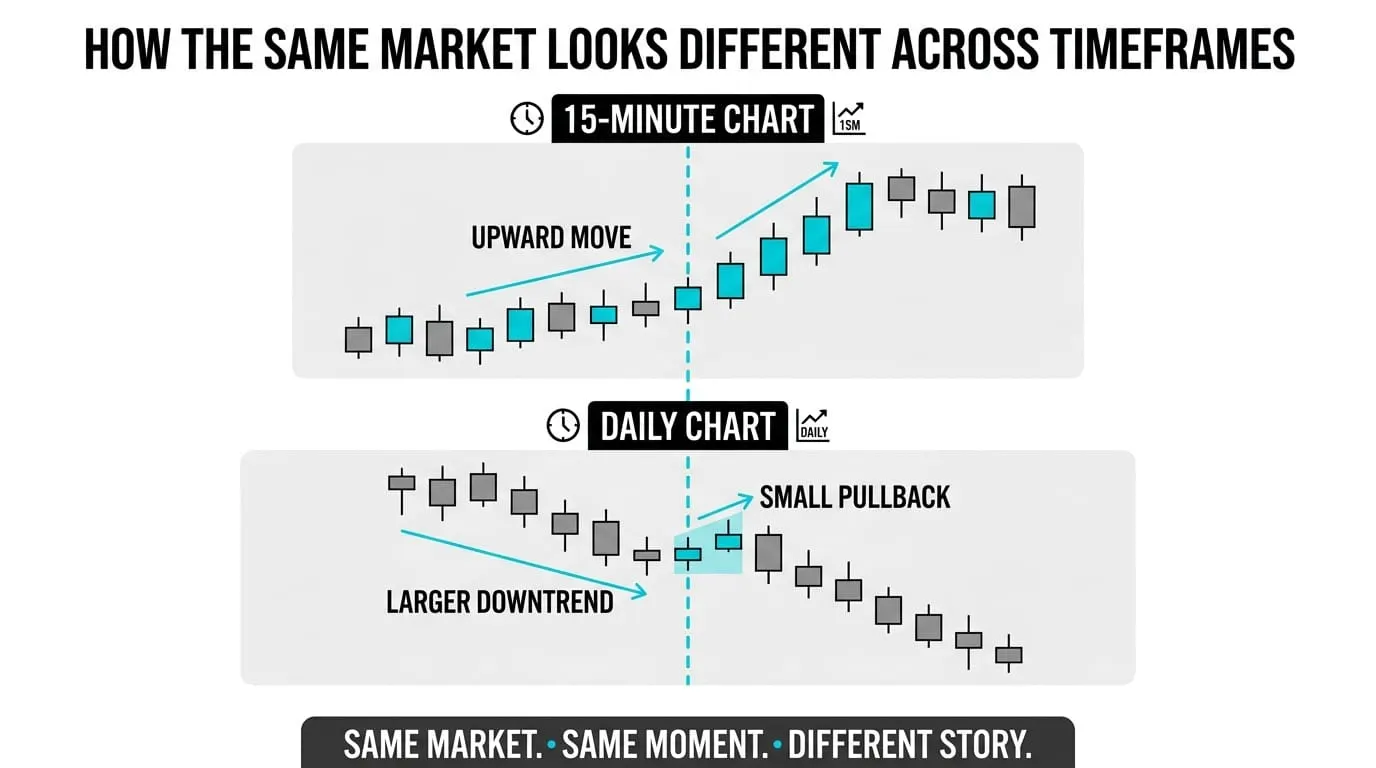
Pull up a stock on the daily chart and you might see a calm, steady uptrend. Now open the 5-minute chart of the same week. You will see sharp drops, sudden spikes, and stretches of ugly chop. Both pictures are accurate.
Neither one is lying. The daily chart answers the question "where is this market heading over weeks?" The 5-minute chart answers "what is happening right now, this hour?" Confusing those two questions is one of the most common beginner mistakes.
A trader who checks the 5-minute chart while holding a position meant to last weeks will see danger everywhere. A trader who checks the daily chart while scalping will miss everything that matters to them. Match the lens to the decision.
The Common Timeframes and Who Uses Them
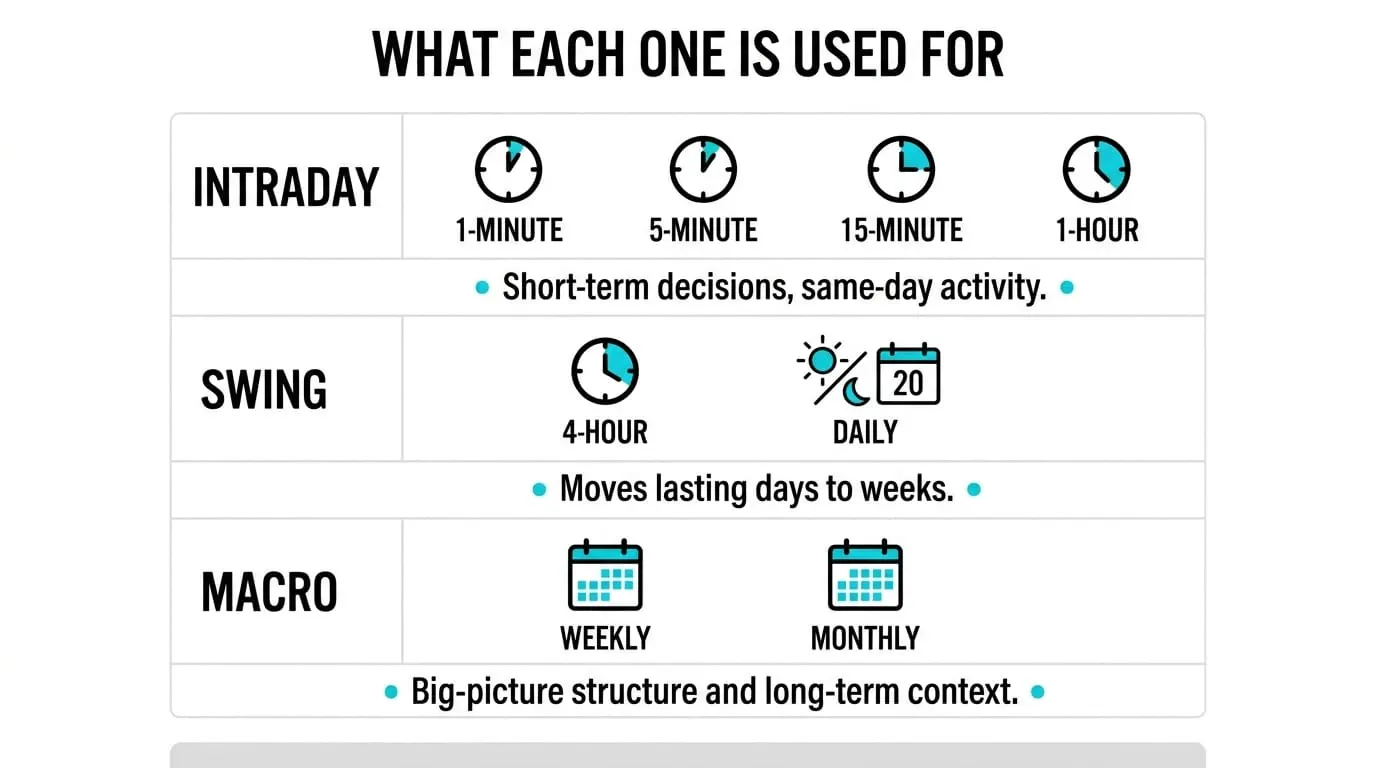
- Monthly: long-term investors and fund managers. Used for multi-year direction and major support and resistance.
- Weekly: position traders and investors. Used to judge the health of a trend over months.
- Daily: swing traders and most retail traders. The standard chart for decisions that play out over days to weeks.
- 4-hour: swing traders who want more detail than the daily without intraday noise.
- 1-hour: active swing traders and some day traders. Used for timing entries within a daily-chart idea.
- 15-minute: day traders. Used to plan entries and exits within a single session.
- 5-minute: day traders and scalpers. Used for fine execution timing.
- 1-minute: scalpers. Used for trades that last minutes, demanding constant attention.
Notice the pattern. The shorter the timeframe, the shorter the decision it serves, and the more attention it demands.
Your Timeframe Should Match Your Life, Not Your Ambition
A position trader can ignore the 5-minute chart entirely. A day trader cannot. That is not a skill difference. It is a job description difference; the full map of styles is in types of traders.
Here is the blunt version: if you can only check the market twice a day, you have no business trading the 5-minute chart. You will miss your exits, chase your entries, and turn a manageable approach into stress. Pick the timeframe your schedule can actually serve.
Screen time is the real constraint. A 1-minute chart demands eyes on the screen for hours. A daily chart asks for fifteen minutes in the evening. Be honest about which one your life allows, because the market will not adjust to your calendar.
A Worked Example: One Week, Two Stories
Imagine a hypothetical stock that drifts from 100 to 104 over one week. Nothing dramatic. A slow climb.
On the daily chart, that week is five quiet green candles. Small bodies, no drama. A swing trader holding from 100 sees a calm, profitable week and sleeps fine.
Now look at the same week on the 5-minute chart. On Wednesday afternoon, the stock drops from 103 to 100 in forty minutes, then recovers to 104 by the close. On the daily chart, that crash is invisible. It is just a wick on one candle, if it shows at all.
A 5-minute trader lived that drop in real time. They had to decide, with money on the line, whether it was a breakdown or a shakeout. The daily trader never even knew it happened. Same stock, same week, same final price. Two completely different experiences, purely because of the timeframe.
Choosing a Starting Timeframe
Start from your constraints, not from what looks exciting. Ask two questions. How often can I realistically check the market? How long am I comfortable holding a decision?
If you can check once or twice a day and you are fine holding for days or weeks, the daily chart is your home. If you can watch for a few hours and want to be flat by the close, the 15-minute or 5-minute chart fits. If you are unsure, start higher. The daily chart forgives slow reactions. The 1-minute chart does not.
You can always add a second timeframe later for context. Many traders check one higher timeframe for direction and one lower for timing. But earn that habit after you can read one chart cleanly.
Timeframes at a Glance
| Timeframe | Typical User | What It Filters Out |
|---|---|---|
| Monthly / Weekly | Investors, position traders | All intraday and most weekly noise |
| Daily | Swing traders | Intraday swings and session noise |
| 4-hour / 1-hour | Active swing traders | Minute-level chop, keeps session structure |
| 15-minute / 5-minute | Day traders | Overnight and multi-day context |
| 1-minute | Scalpers | Nearly all broader context |
Read the last column carefully. Every timeframe hides something. Lower timeframes hide the big picture. Higher timeframes hide the short-term danger. There is no chart that shows everything, which is why the choice matters.
Questions About Timeframes on a Chart
Which timeframe is best for beginners?
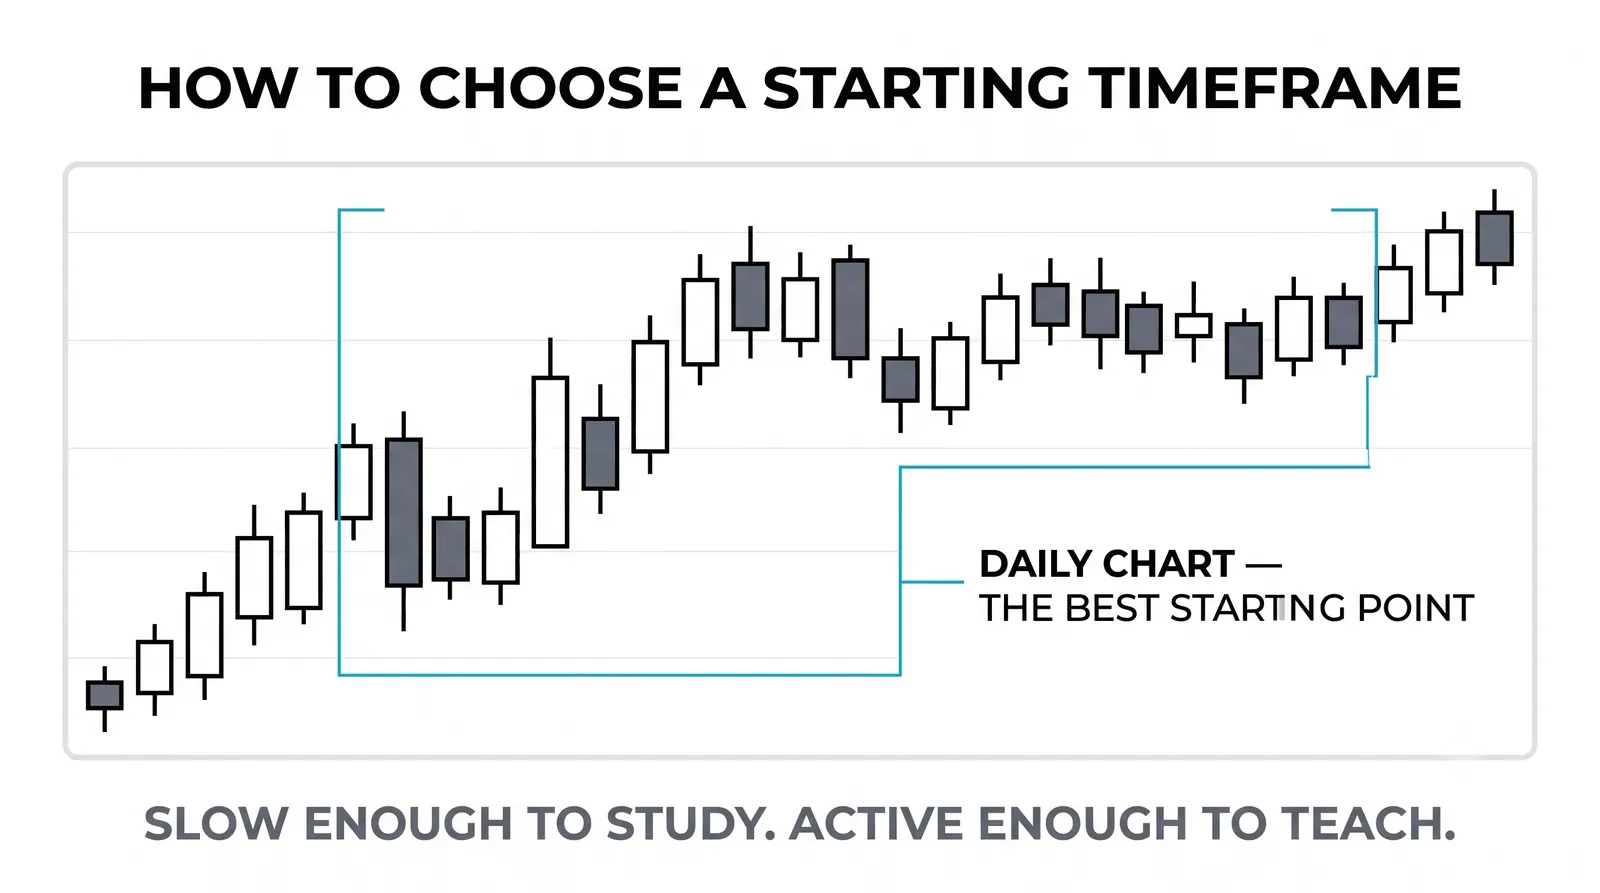
The daily chart is the best starting point for most beginners. It moves slowly enough to think, it filters out intraday noise, and it only asks for a few minutes of attention per day. Move down only when you have a specific reason and the schedule to support it.
Should I check multiple timeframes?
Yes, once you can read one timeframe well. A common approach is to use a higher timeframe for direction and a lower one for entry timing. Checking five timeframes as a beginner usually creates confusion, not clarity, so keep it to two at most.
Does a signal on one timeframe override another?
No timeframe automatically overrides another, but higher timeframes generally carry more weight because they reflect more trading activity. A buy signal on the 5-minute chart that fights a clear daily downtrend is a weaker bet than one that aligns with it.
Do higher timeframes matter more?
For context, yes. Levels and trends on the daily and weekly charts are watched by more participants, so they tend to be respected more often. But "matter more" depends on your trade. A scalper's 5-minute structure matters more to their trade than the monthly chart does.
Once you are comfortable reading one timeframe, the natural next step is learning how support and resistance levels behave differently depending on which chart you draw them on. That is where timeframe choice starts paying for itself.