Indicator Settings and Parameters
Every indicator ships with default parameters, and those parameters are conventions, not truths. The 14 in RSI, the 12, 26 and 9 in MACD, the 20 in Bollinger Bands: none of them were discovered in the data. They were chosen by the indicator's creator as reasonable starting points, printed in a book, and copied into every charting platform since.

Customizing is legitimate. But every change you make just repositions you on the same tradeoff between speed and reliability. A shorter setting reacts faster and lies more often. A longer setting lags more and lies less. There is no configuration that escapes this, and most aggressively tuned settings are memorized history rather than insight.
Think of a new guitar arriving in standard tuning: you can retune it for any song, but the strings hold no magic in the tuning pegs. The defaults are a shared starting point, not a hidden answer.
What a Setting or Parameter Actually Controls
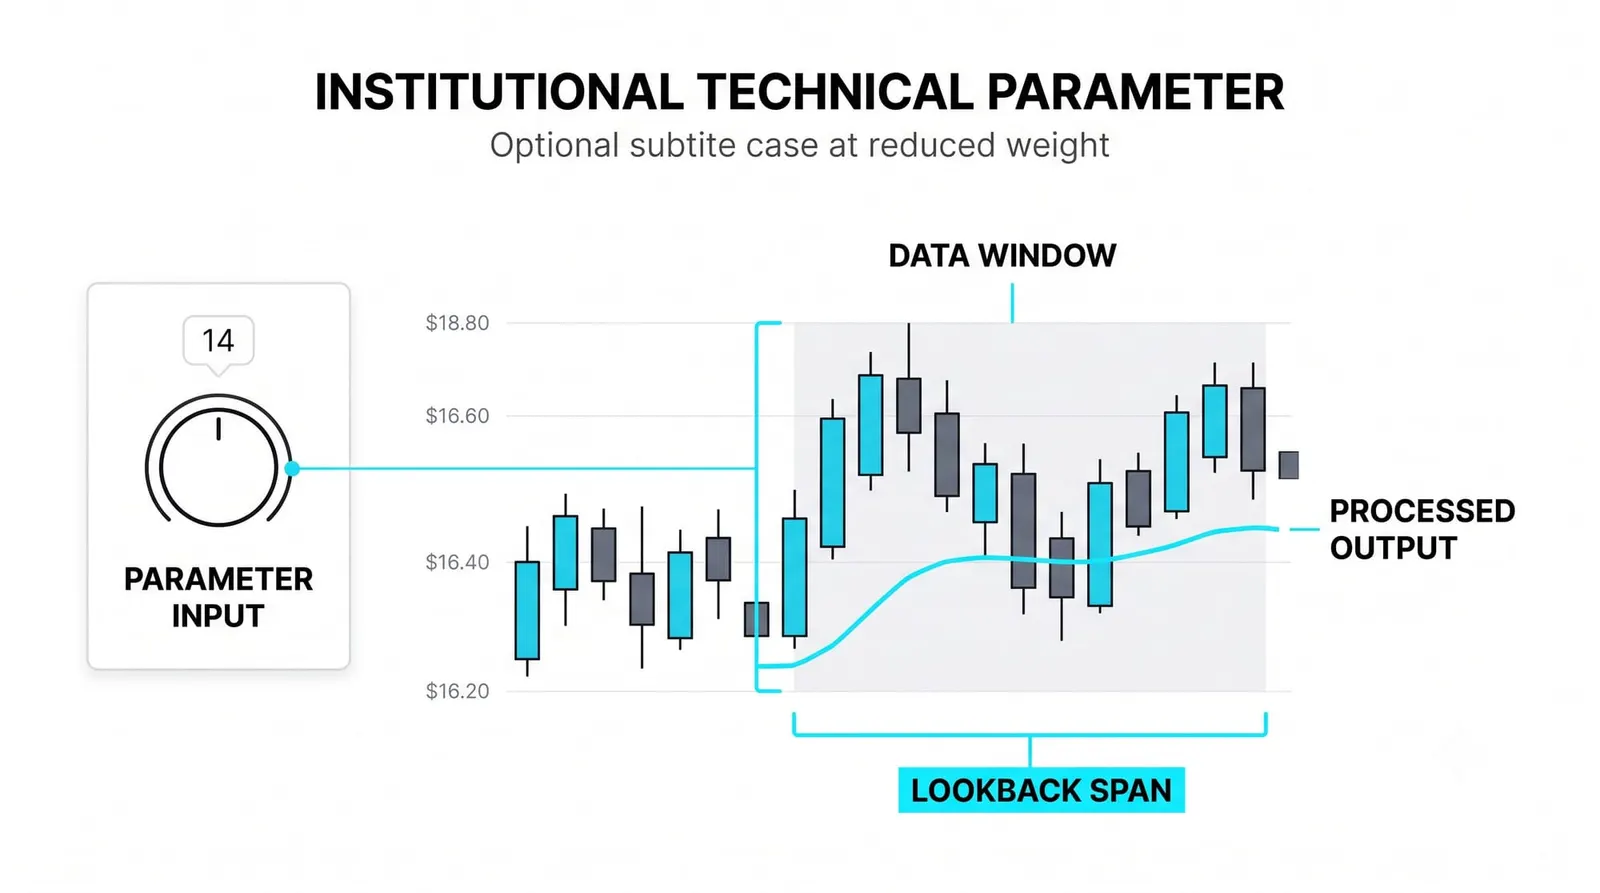
A parameter is a dial on a formula. A period is a window size: how many candles the calculation looks back over. A multiplier is a sensitivity knob: how strongly the output reacts to each new bar. Change the number and you change the window or the sensitivity. Nothing more.
You met this dial already. The moving average lessons covered periods and the lag-versus-smoothness tradeoff in detail; parameters are that same dial made explicit across every indicator you will ever load.
The MACD's 12, 26 and 9 were introduced as convention earlier in this level. This lesson explains why those conventions exist and when it makes sense to leave them alone.
Here is the blunt version. No setting adds information the chart lacks. Every indicator is built from the same open, high, low, close and volume. Retuning a parameter rearranges that existing data. It cannot reveal anything that was not already in the candles.
Why Default Settings Aren't Automatically Wrong
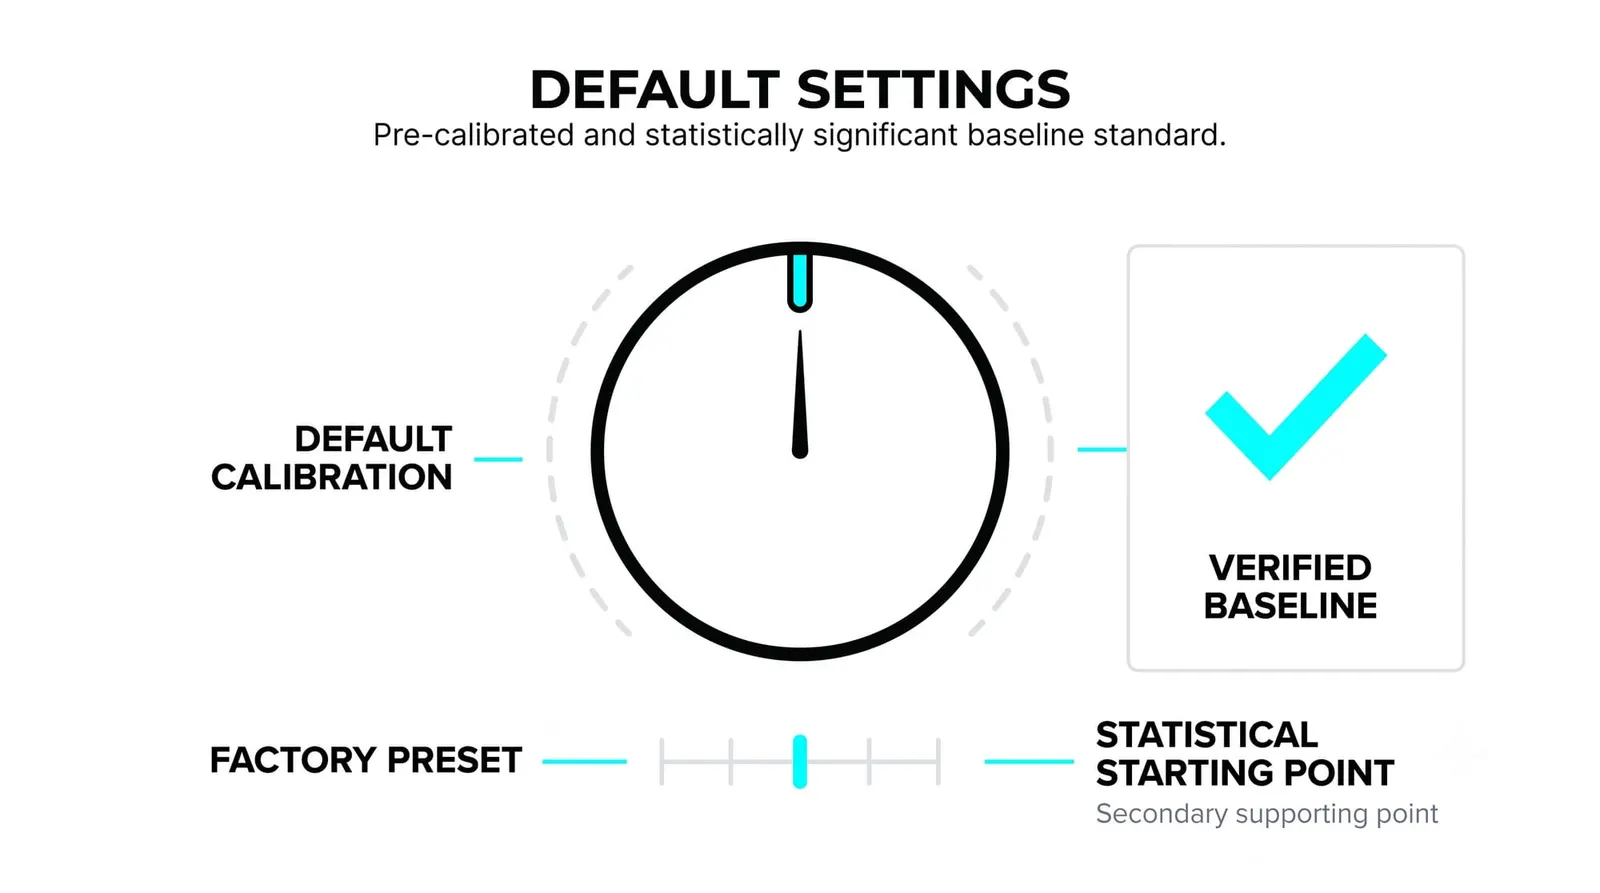
Defaults survived because they were legible and shared. The original ATR/RSI framework chose 14 for RSI, and it stuck partly because it was reasonable and partly because everyone after used it. Legibility compounds: a setting that millions of traders can read the same way becomes a common language.
The crowd matters more than most traders admit. A level everyone watches partly works because everyone watches it. If thousands of traders see the 200-day average as a line worth respecting, their orders cluster there, and the line gains real influence. The default is not magic. It is a meeting point.
Exotic settings trade the crowd's eyes for a private curve. Your 17-period average may fit recent data beautifully, but nobody else is watching it, so it carries no shared weight. That does not make it useless. It makes it a personal filter rather than a widely respected level, and you should know which of the two you are holding.
What Happens When You Change a Setting
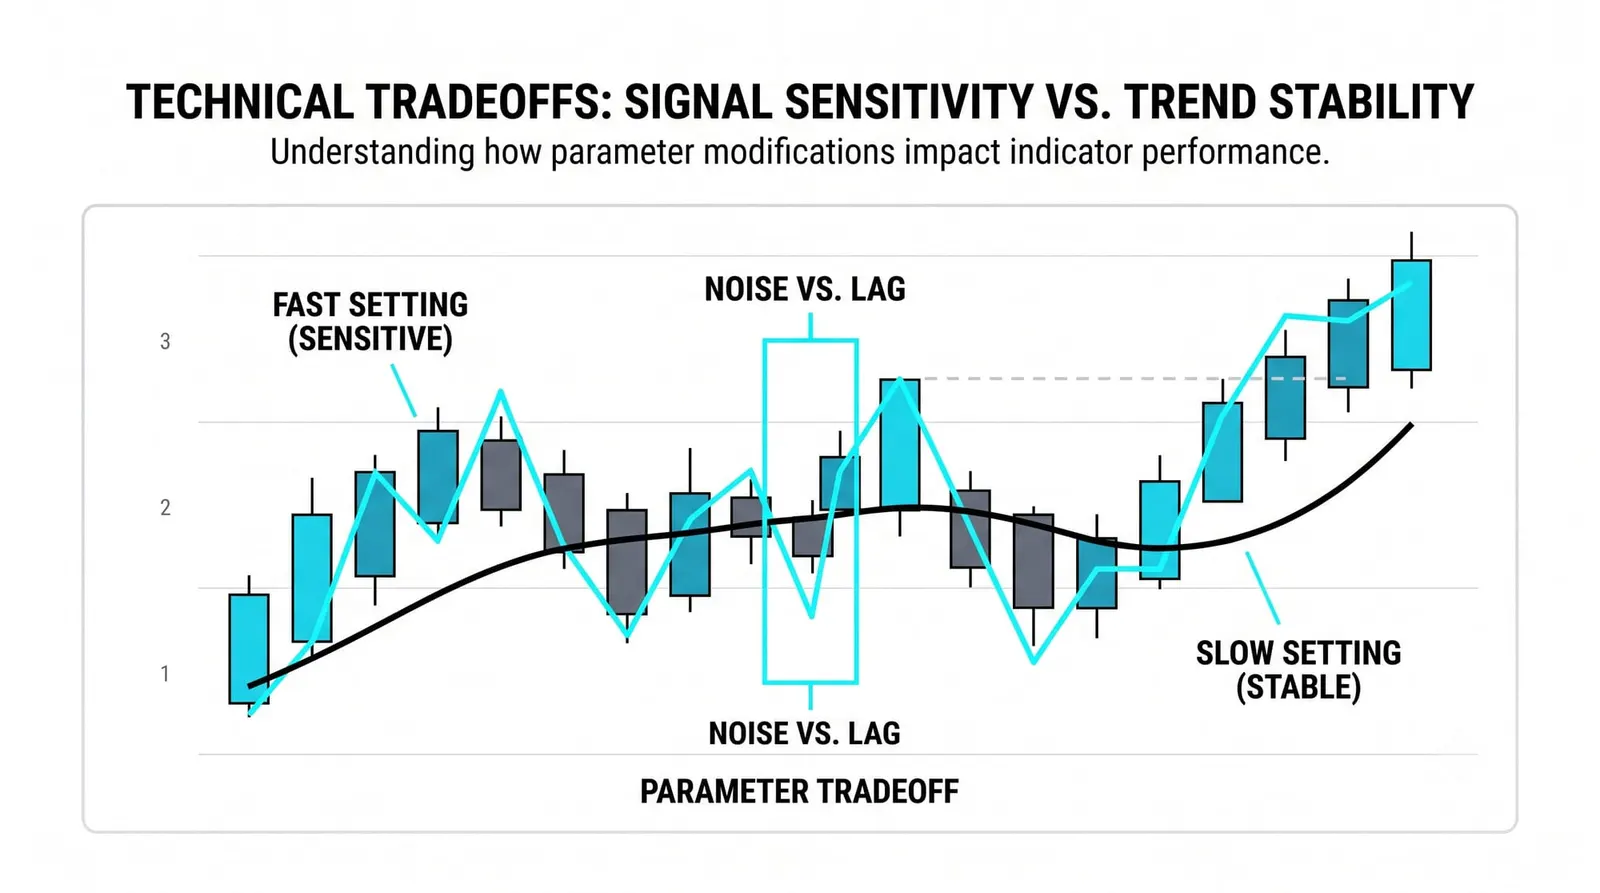
Shorten the window and the tool speeds up. A 5-period average turns with price almost immediately. You catch moves earlier, and you get chopped apart in sideways stretches, because every small wiggle registers as a signal. Faster turns, more false signals. That is the full cost.
Lengthen the window and the tool calms down. A 100-period average ignores most of the noise and only bends when a real move is underway. The price you pay is lateness: by the time it confirms, a chunk of the move is gone. Smoother lines, later answers.
Notice what never happens. The dial never breaks the tradeoff. Traders burn months searching for the period that is both fast and reliable, and it does not exist, because speed and reliability are two ends of one slider. Moving toward one moves you away from the other, every single time.
How to Adjust Without Guessing
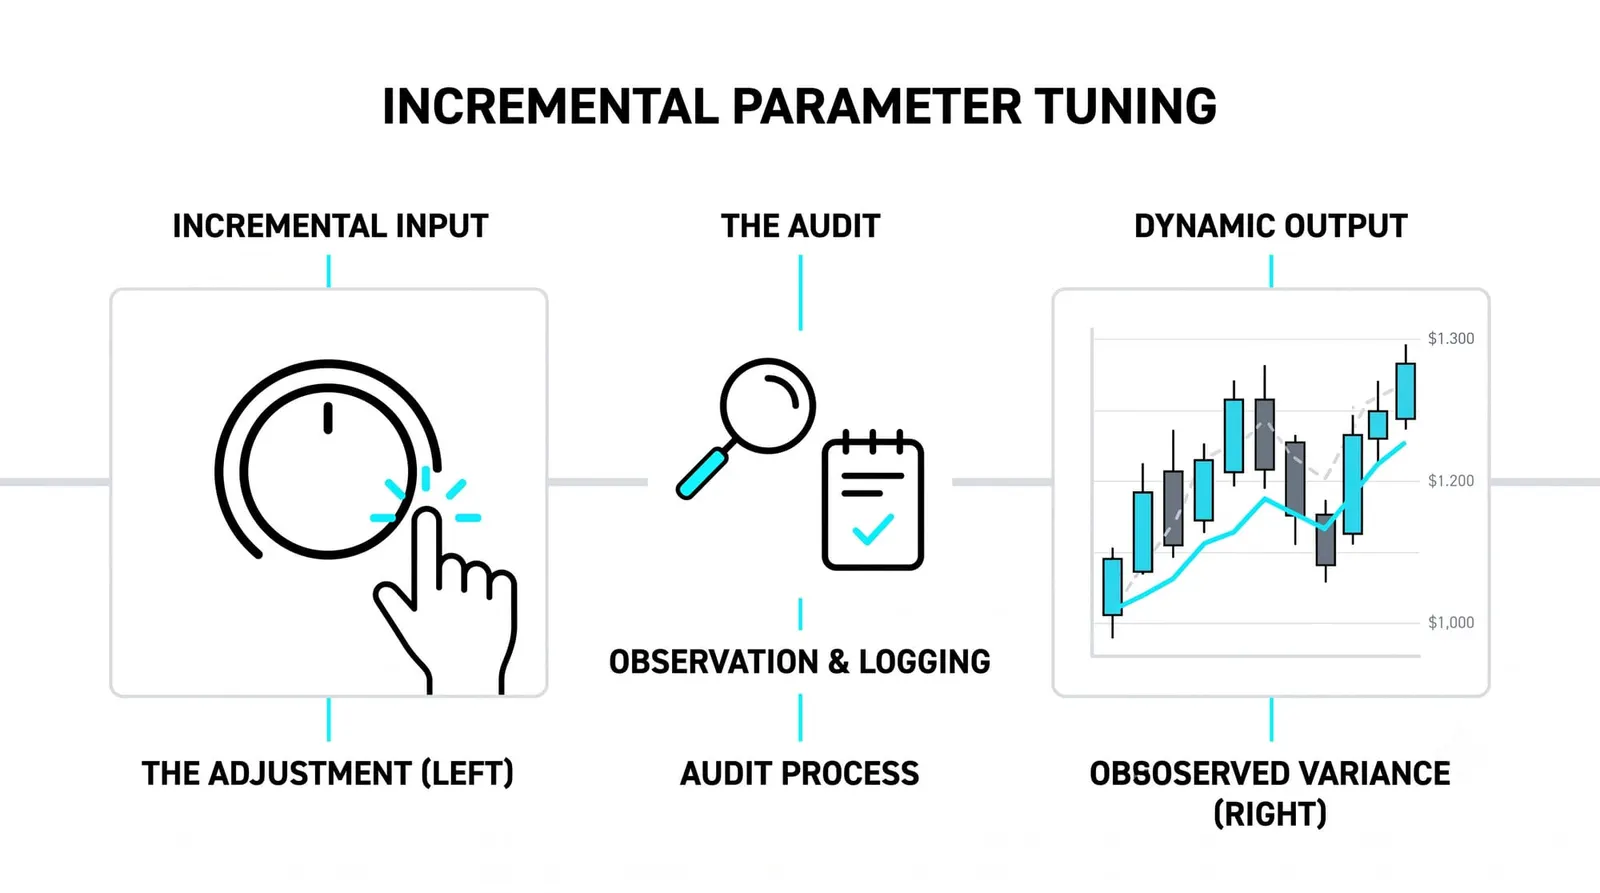
Change one thing at a time. If you alter the period and the multiplier together and the result improves, you have no idea which change did the work. One variable per experiment is the only way to learn anything from the experiment.
Judge a setting on decisions changed, not on how often the line flattered you. A good question: did this setting get me in earlier on moves I actually traded, or out before losses I actually took? A bad question: does the line look smoother on the chart? Pretty curves are not a trading edge.
Build the walk-forward habit. Tune your setting on one stretch of historical data, then check it on the next stretch it has never seen. A parameter that only works backward, on the data it was fitted to, is curve-fitting. Distrust anything that shines in the past it was built on and falls apart the moment it meets new bars.
And set a high bar for changing anything at all. A new setting should beat the default on unseen data, across different conditions, by a margin that survives your skepticism. If the improvement is marginal, keep the default and keep the crowd.
One Average, Three Periods
Here is a hypothetical illustration with round numbers. A stock drifts from 40 to 52 over 60 trading days, with three pullbacks along the way. You test three moving averages on the same stretch and count the crosses, treating each cross of price through the average as a signal.
The 10-period average crosses 6 times. Four of those crosses whipsaw: price dips through during a pullback, flips back within days, and the signal reverses before it pays. You were early to the real turns and repeatedly shaken out of them.
The 20-period average crosses 3 times. One whipsaws. It catches the genuine turns a few candles later than the 10-period did, but two of the three pullbacks never trigger it at all. Fewer decisions, fewer mistakes.
The 50-period average crosses once, late in the stretch, after the drift up is well established. Clean, and slow. It ignored all three pullbacks entirely.
Which setting wins depends on your decision clock. A trader holding positions for days finds the 10-period's speed useful and accepts the whipsaws as the cost. A trader holding for weeks wants the 20-period's balance. A trader holding for months wants the 50-period's silence and does not care that it is late. Now the trap: a backtest of this exact stretch would crown whichever period happened to fit these 60 days best. That winner was fitted to this history. It is not automatically yours, because your next 60 days will not replay this stretch.
What Each Choice Buys and Costs
| Setting style | What it buys | What it costs |
|---|---|---|
| Very short periods | Earliest possible signals; catches turns near their start | Frequent whipsaws; noise reads as signal; more decisions to manage |
| Standard periods | Shared language with the crowd; self-reinforcing levels; decades of documented behavior | Nothing tailored to your timeframe; you see what everyone sees |
| Long periods | Smooth, stable reads; filters out most noise; few false alarms | Late confirmation; large portions of moves pass before the signal |
| Optimizer-tuned periods | Best possible fit to the historical stretch tested | Memorized history; fragile on new data; no crowd watching the same line |
Read the last row carefully. Optimization feels like rigor and usually delivers the opposite. The tighter a setting hugs the past, the less it says about the future.
Indicator Settings, Answered
Should you change default indicator settings?
Only when you have a specific reason tied to your trading timeframe, and only after testing the change on data it was not tuned on. If you cannot state in one sentence why the default fails for your style, keep it. The defaults carry the crowd's attention, and that attention has real value.
What do shorter periods do to a moving average?
Shorter periods make the average react faster and whipsaw more often. The line hugs price closely, turns at every minor swing, and generates more signals, of which a larger share are false. You gain speed and pay for it in reliability, always.
Why do most traders keep the defaults?
Partly habit, partly rationality. Defaults are the settings everyone else watches, so levels and signals built on them attract clustered orders and partly validate themselves. Changing to a private setting means giving up that shared attention, and many traders decide the trade is not worth it.
How do you avoid overfitting indicator settings?
Tune on one stretch of data and validate on a separate, later stretch the setting has never seen. Change one parameter at a time, demand that improvements persist across different market conditions, and reject any setting whose brilliance exists only in the data used to find it. When in doubt, the default plus discipline beats the optimized curve plus hope.
You now have the full indicator layer: what these tools compute, how each family behaves, and how to set them without fooling yourself. The next level puts indicators to work inside complete strategies, where they take a supporting role behind the price action and structure you learned first.