Pseudo Upthrust and Professional Selling
A pseudo upthrust is professional-looking selling pressure that shows up in a rising market instead of at a top: price is marked up rapidly on a wide spread and high volume, often through old highs, then falls back to close in the middle or lower part of the bar. The shape is identical to the true upthrust you already studied. The meaning is not. On its own it is a warning that requires confirmation, not a verdict.

Think of it as a fire drill: it looks exactly like a real evacuation, and only the next few minutes tell you which one it was. The bar is the alarm. The next few bars are the minutes. Your job is to read those minutes calmly instead of sprinting for the exit or ignoring the alarm entirely.
What a Pseudo Upthrust Looks Like
The anatomy is simple. Price gaps up or drives up sharply, frequently through prior highs or a visible resistance level. The spread is wide, clearly wider than the bars around it. Volume is clearly high, often the heaviest in weeks.
Then the close comes off the highs and lands in the middle or lower part of the bar. That close tells you someone sold into the strength. Buyers pushed price up, and enough supply arrived to knock it back down before the bell.
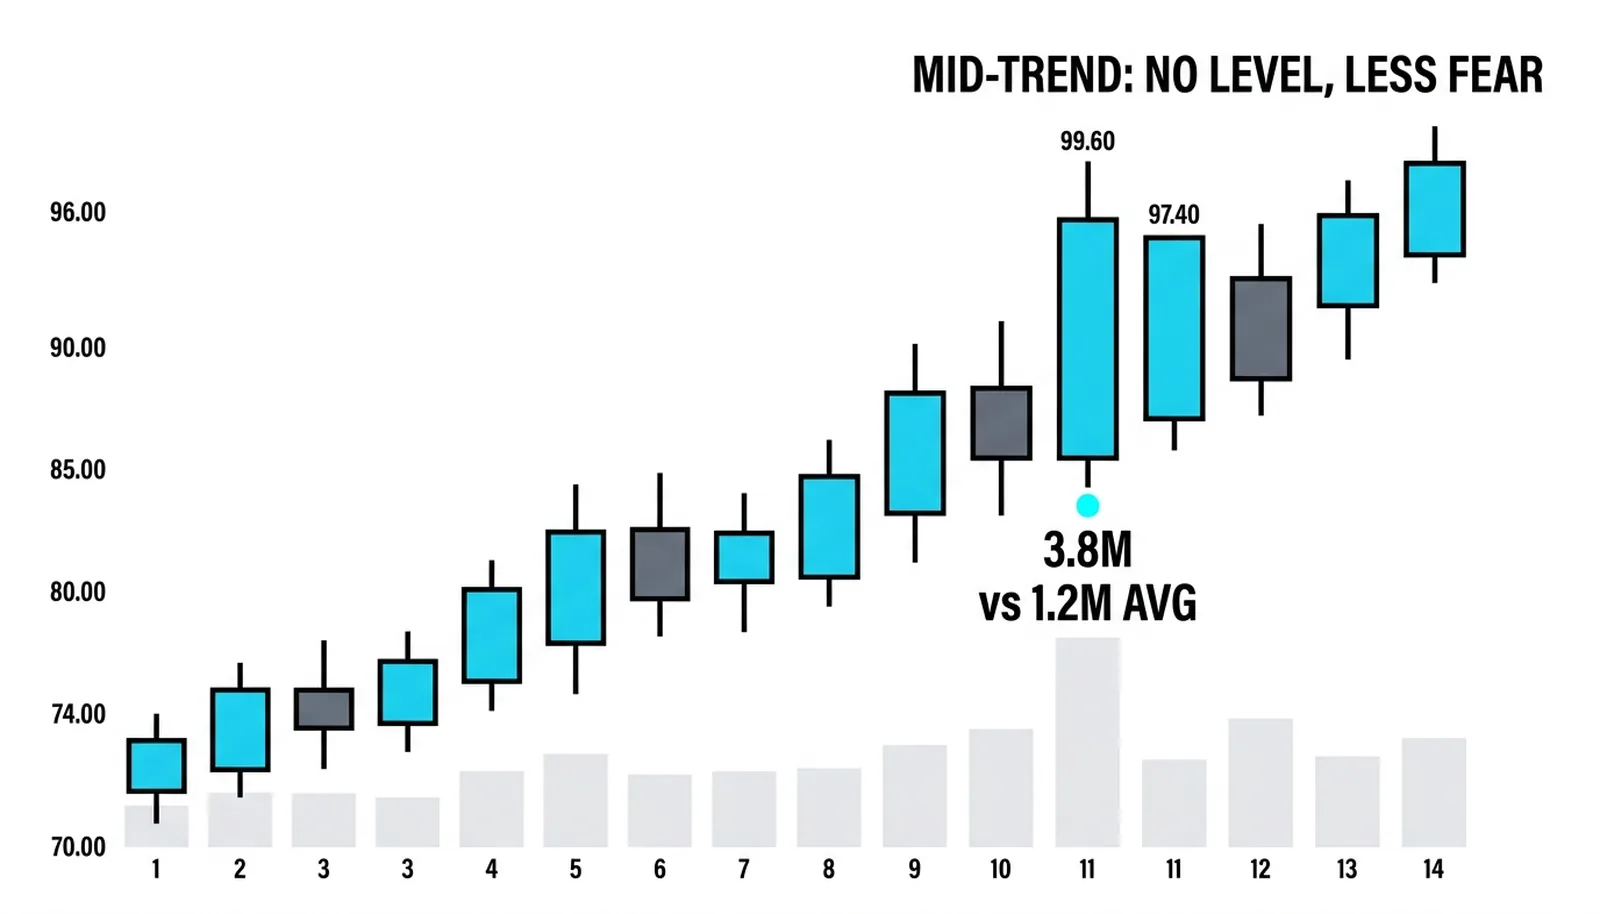
Every one of those elements matches the true upthrust from the previous lesson. Wide spread, high volume, close off the highs. If you covered only this bar in isolation, you could not tell the two apart.
The difference is the address. The true upthrust arrives after distribution, at the top of a range, where the failed breakout carries the whole story. This bar arrives inside a markup phase, while the trend is still alive. Same fingerprint, different address.
Why Location Changes the Verdict
A true upthrust sits at the end of something. The market has been distributed, the breakout attempt fails, and the failed breakout itself is the evidence. The location does the convicting.
A pseudo upthrust sits in the middle of something. It appears early in a trend, after a brief pullback, or partway through a healthy advance. In that setting, an upthrust-shaped bar is common and often harmless. Strong trends produce them regularly.
Why? Because rising markets attract profit-taking at every round number and every old high. Some of that selling is routine. Some of it is large holders unloading into strength. The bar alone cannot separate the two.
The same shape at a different address is a different animal.
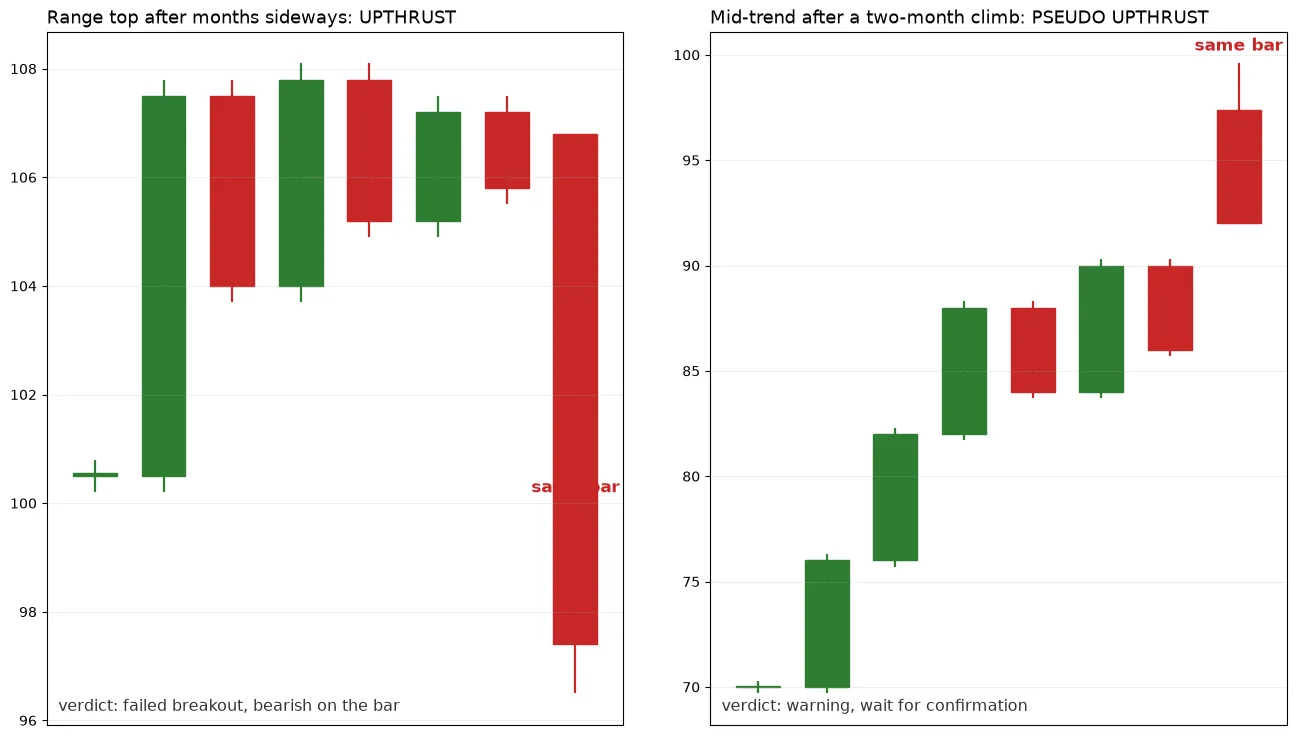
This is why the previous lesson could treat the upthrust as close to a verdict, and this one cannot. In a rising trend, the burden of proof shifts. The market is innocent until the next bars prove otherwise.
The Confirmation Rules
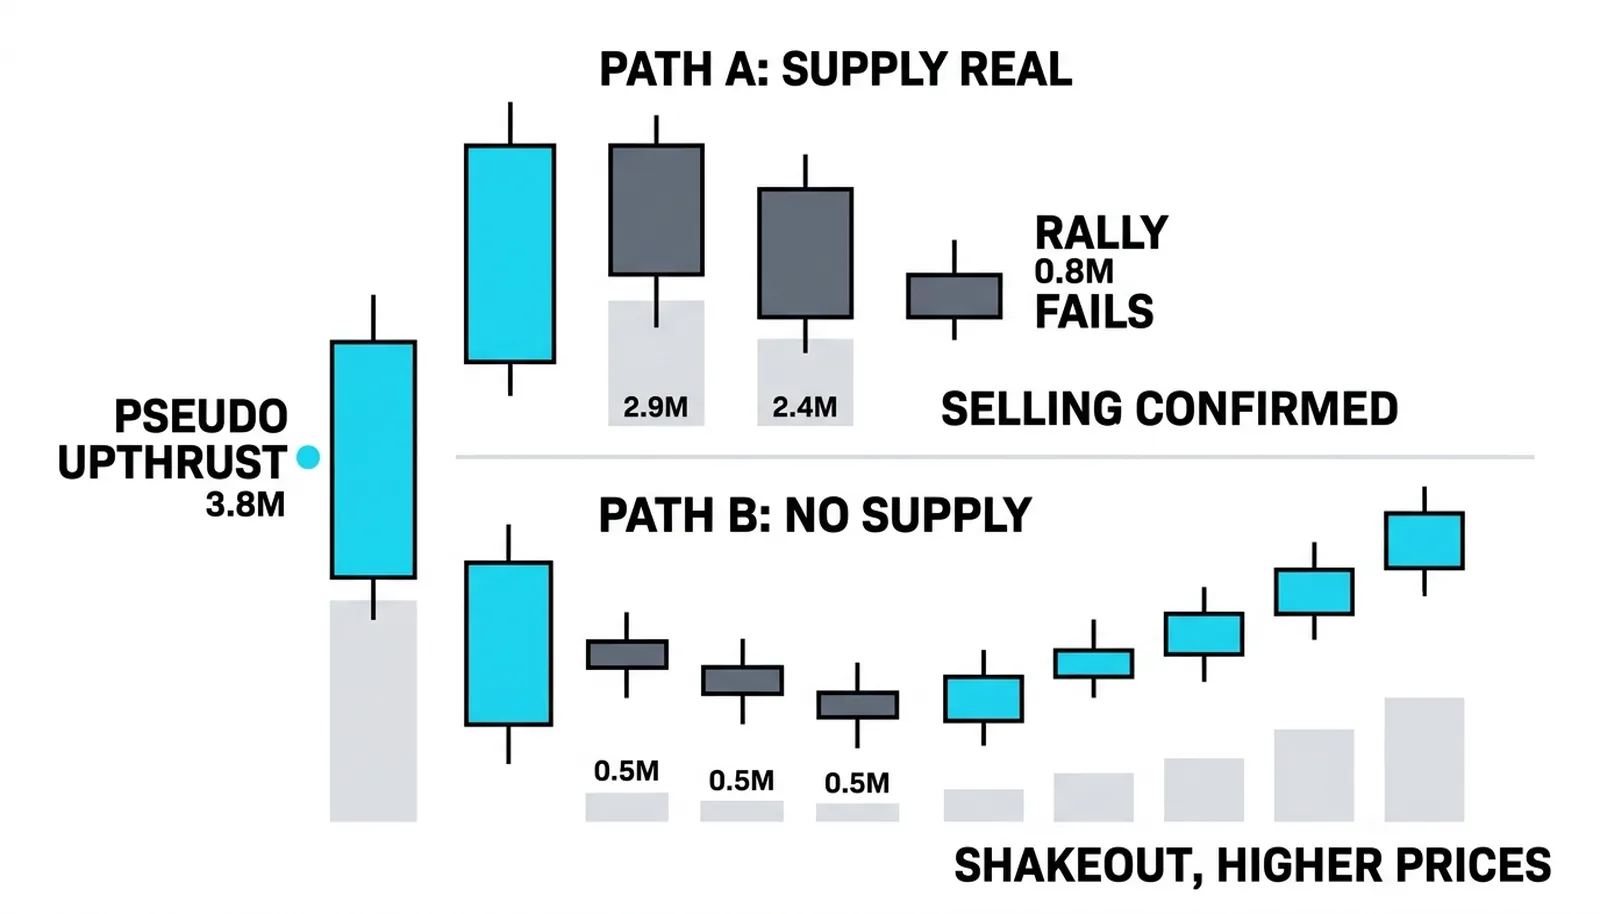
After a pseudo upthrust, the market takes one of two paths, and each path answers a specific question: was that heavy volume real supply, or was it absorbed?
Path one: weakness confirms. The following bars fall on high volume. Down bars printing volume near or above the pseudo upthrust's own volume tells you the selling continues. Then watch any rally back up. If price tries to recover on thin volume and stalls below the pseudo upthrust's high, that is no demand. Heavy selling followed by a weak rally means the professional selling was real, and the top may be in.
Path two: no supply denies. The market drifts down, but the down bars print low volume, well below the pseudo upthrust's volume. Falling price on shrinking volume means sellers are not actually pressing. That reading suggests the mark-up was a test or a shakeout of weak holders, and the market is likely to go higher. This is the no supply signature doing its quiet work.
Two concrete checks, then:
- Volume on the following down bars. High and rising means real supply. Low and shrinking means no supply.
- Quality of any rally back toward the high. Strong volume and a close above it means demand absorbed the selling. Weak volume and a stall below it means demand is gone.
When in doubt, wait one bar. The market prices its own answer quickly, usually within two or three sessions. One bar of patience costs almost nothing. Acting on the bar alone costs plenty when it turns out to be a shakeout.
Professional Selling, Stated Honestly
The standard story goes like this. Large players hold size they want to sell. Selling size into a quiet market crushes the price against them. So they mark price up into strength, through old highs where breakout buyers and stop orders wait, and sell into that surge of demand. The wide spread up creates the crowd; the crowd provides the exit.
That story is a model of intent, not proven intent. You cannot see who sold or why. You cannot verify that a single coordinated player marked the price up. Anyone who tells you the bar proves manipulation is overstating the evidence.
What you can see are the measurements. The wide spread. The heavy volume. The close off the highs. The location inside a rising trend. Those are facts printed on the chart. The liquidity narrative explains them memorably, and it is a useful working model, but the measurements are what you trade.
Hold both ideas at once. Use the professional-selling story to know what to look for. Use the observable facts and the confirmation rules to decide what to do. That discipline turns the pseudo upthrust into what it should be: a warning that costs one bar of patience and can save weeks of holding through a top.
One Bar, Two Futures
Everything below is hypothetical, with invented round numbers, to show how the two paths read in practice.
A stock climbs steadily from 70 to 96 over two months. Average daily volume runs about 1.2 million shares. Then it gaps up to 99.6 one morning, trades a spread of 3.1 points, and prints 3.8 million shares, more than triple the average. The close is 97.4, right at mid-bar. Wide spread, very high volume, close off the highs, inside a rising trend. Textbook pseudo upthrust.
Path A. The next two sessions print down bars on 2.9 million and 2.4 million shares. Heavy volume on weakness: supply is real. Then a rally attempts to recover, reaching 98.9 on only 0.8 million shares, and fails below the high. No demand on the way back up. Both checks point the same way. Professional selling confirmed, and in this illustration the stock breaks 93 within two weeks.
Path B. The next session drifts down to 96.8 on just 0.5 million shares, less than half the average. Falling price on thin volume: no supply. The selling was absorbed. In this illustration the stock then climbs to 108 over the following month, and the pseudo upthrust becomes a footnote.
| Stage | Price | Volume | Reading |
|---|---|---|---|
| Pseudo upthrust bar | Gaps to 99.6, closes 97.4 | 3.8M vs 1.2M avg | Wide spread, high volume, mid-bar close: warning only |
| Path A confirmation | Down bars, then rally fails at 98.9 | 2.9M, 2.4M, then 0.8M on rally | Heavy supply, no demand: selling confirmed |
| Path B no-supply | Drifts to 96.8 | 0.5M | Weak volume on weakness: shakeout, uptrend intact |
| Verdicts | A: breaks 93; B: climbs to 108 | Decided by the bars after | The bar warns; the confirmation decides |
Note what the table makes plain. The pseudo upthrust bar is identical in both futures. Everything that differs happens afterward. That is the skill: read the warning, then let the following bars answer.
Pseudo Upthrust, Answered
What is a pseudo upthrust in VSA?
It is an upthrust-shaped bar, wide spread up, high volume, close in the middle or lower part of the bar, that appears inside a rising market rather than at a top. It warns of possible professional selling but requires confirmation from the following bars before it means anything actionable.
How is a pseudo upthrust different from a regular upthrust?
Location. A true upthrust appears at the top of a range or after an extended advance, where the failed breakout is itself the evidence. A pseudo upthrust appears inside a markup phase, where the same shape is common and often harmless, so the burden of proof falls on the bars that follow.
What confirms a pseudo upthrust?
Follow-through weakness: down bars on high volume after the bar, plus a rally back toward the high that fails on low volume. The opposite reading, a low-volume drift down, denies it and suggests a test or shakeout.
Can a pseudo upthrust be bullish?
Yes. When the following bars show no supply, the mark-up reads as a test or a shakeout of weak holders, and the market often continues higher. The bar is a question, and sometimes the answer favors the bulls.
Next in this block, the focus shifts from a single bar to the ground it stands on: why location is everything in VSA, and how the same volume signature means opposite things at support, at resistance, and in the middle of nowhere.