The P/E Ratio: How to Use It
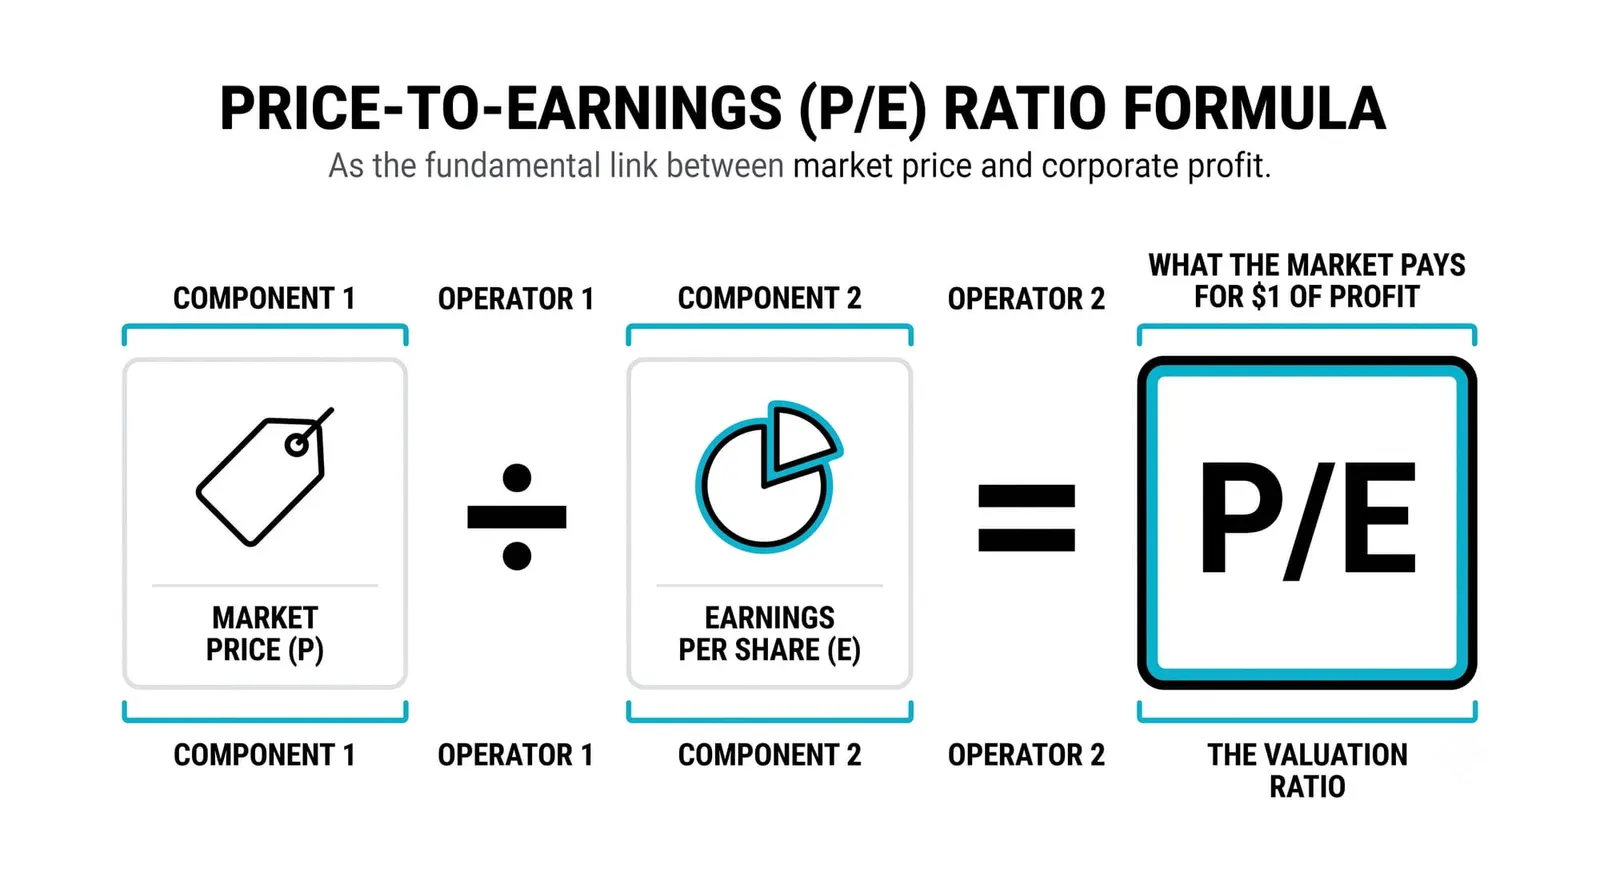
The P/E ratio is a company's share price divided by its earnings per share, and it answers one question in a single number: how many years of current profit you are paying for when you buy the stock today. Take the price, divide by EPS, and you get a figure like 12 or 25 or 40. That figure is the market's asking price, expressed in years of earnings.

Think of a P/E of 20 as a price tag written in years: you are paying for twenty years of today's profit before any growth arrives and before anything goes wrong. That framing matters because it turns an abstract multiple into something you can judge. Would you pay twenty years of profit for this business? Sometimes yes, sometimes no. The ratio does not decide for you. It tells you what the deal actually is.
The previous lesson covered earnings per share, the bottom half of this fraction. If EPS is fuzzy to you, go back there first, because every problem with the P/E starts with a problem in the E.
What the P/E Ratio Actually Tells You
The formula is simple. Share price divided by earnings per share. A stock at 50 with EPS of 5 trades at a P/E of 10. A stock at 50 with EPS of 1 trades at a P/E of 50. Same price, wildly different deals.
Where it gets interesting is which EPS you use. There are two standard versions.
Trailing P/E uses the last twelve months of reported earnings. It is real, audited, finished. It is also backward-looking. You are pricing the company on what it already did.
Forward P/E uses analysts' estimates of the next twelve months. It points where the business is going, but it rests on forecasts, and forecasts get revised. Optimistic estimates make a stock look cheaper than it is.
One looks in the rearview mirror, the other through the windshield. Both are useful. Neither is sufficient alone. When the two diverge sharply, that gap itself is information: the market expects profit to change fast, one way or the other.
The intuition underneath all of this is a payback period. If profit stayed frozen at today's level, a P/E of 15 means fifteen years to earn back your purchase price through the company's profits. Real businesses do not stay frozen, which is exactly why the next section exists.
High P/E vs Low P/E: What Each Might Signal
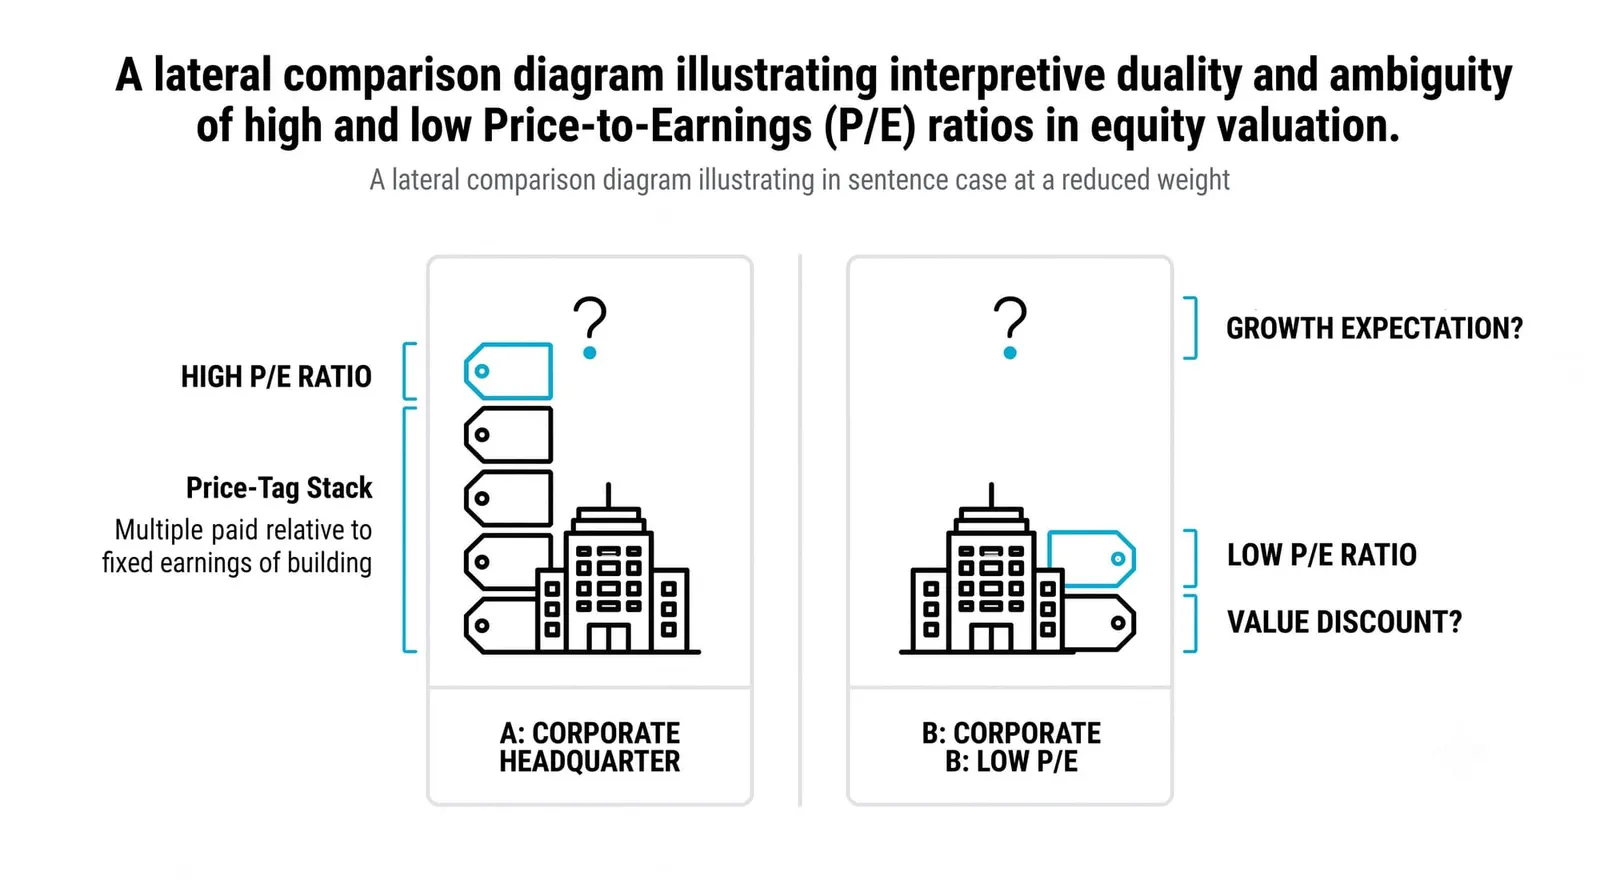
A high P/E usually means the market expects profits to grow. Paying forty years of current earnings sounds expensive until you realize buyers expect earnings to double or triple, shrinking the real payback period. High multiples can also reflect scarcity, when a company is the only way to own a certain kind of business, or simply mania, when a story gets ahead of the arithmetic.
A low P/E can mean the opposite set of things. Sometimes a solid company is ignored, unfashionable, or temporarily out of favor, and the low multiple is neglect. Sometimes the market sees decline coming and prices it in early. Sometimes a low P/E marks genuine distress, where the E is about to shrink and the multiple only looks cheap.
Neither number is a verdict. A P/E of 8 can be the most expensive stock on the board if earnings halve next year. A P/E of 40 can be reasonable if earnings triple. The multiple is the market's opinion, not a fact about value.
Your job is to figure out which story the number is telling. That requires comparison, which is where the ratio becomes genuinely useful.
Why P/E Only Makes Sense in Comparison
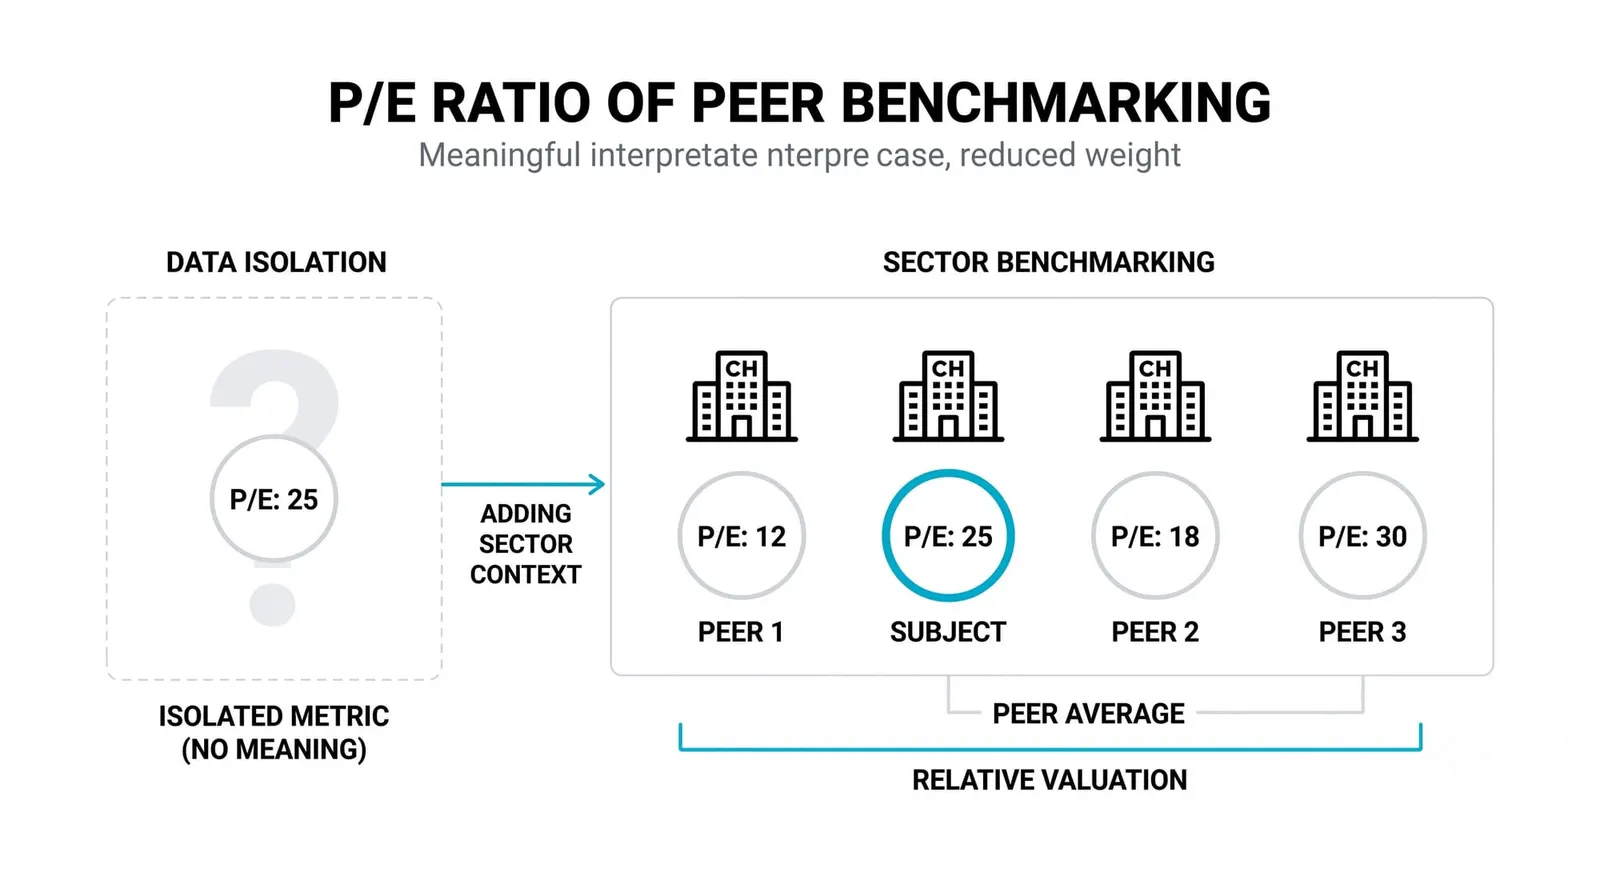
A P/E of 15 means nothing floating in space. It gains meaning in three frames.
- Against the company's own history. If a business has traded between 18 and 25 for a decade and now sits at 13, something changed. Either the market is wrong or the business is. Find out which.
- Against its industry. Banks, utilities, and grocers habitually trade at low multiples because their growth is slow and steady. Software and biotech habitually trade high. Compare a company to its peers, not to the whole market.
- Against the market average. The broad index has its own P/E, which rises and falls with the cycle. A stock at 20 in a market at 15 carries different expectations than a stock at 20 in a market at 25.
A P/E of 15 is cheap for a business growing earnings at 12 percent a year and expensive for one shrinking at 5 percent. Same number, opposite conclusions. Context is the entire tool.
Underneath every multiple sits interest rates. As covered earlier this level, higher rates raise the return available from safe assets, which pushes all valuation multiples down, and lower rates lift them. When you compare a company's current P/E to its history, check what rates were doing in that history. A multiple that looked normal when rates were near zero may be unsupportable when they are not.
The Limits of Relying on P/E Alone
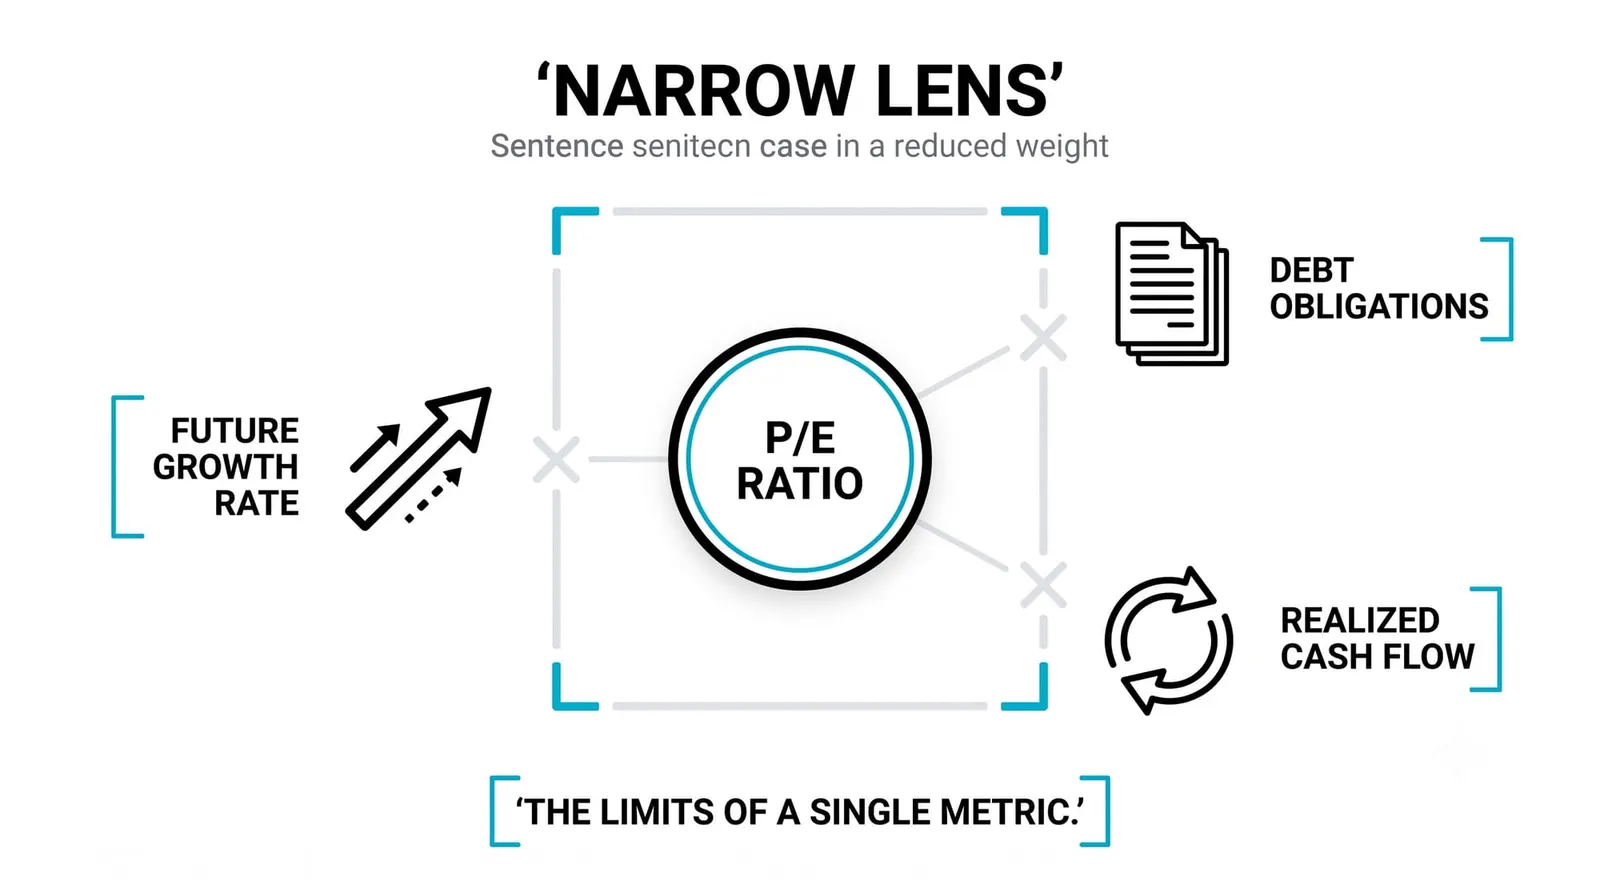
Start with the most dangerous failure mode: the E can collapse after you buy. You pay 10 times earnings, earnings fall by half, and without the price moving at all you now hold a stock at 20 times earnings. The multiple re-rates against you silently. This is why cheap-looking stocks in declining industries keep burning people.
Second, one-off items distort the profit line. A company that sells a division books a huge one-time gain, EPS spikes, and the P/E looks absurdly low. A company taking a restructuring charge shows depressed earnings and an inflated P/E. Serious analysis strips these out, but the headline number you see on a screener does not.
Third, companies losing money have no meaningful P/E at all. Divide by a negative EPS and you get a negative multiple, which tells you nothing about value. Young growth companies, cyclicals at the bottom of a cycle, and distressed firms all fall into this bucket. The ratio simply does not apply, and any screener showing a number there is showing you noise.
Fourth, accounting choices shape EPS. Depreciation schedules, write-down timing, and share buybacks all move the denominator. Two identical businesses can report different EPS.
The P/E is a starting filter, not a conclusion. It tells you where to dig, never what you will find.
Two Companies, Same P/E
Here is a fully hypothetical illustration with round numbers.
Company A trades at 40 per share and earns 2 per share. Company B trades at 10 per share and earns 0.50 per share. Run the math on both: 40 divided by 2 is 20, and 10 divided by 0.50 is 20. Identical P/E ratios.
Now add the story. Company A grows earnings at 15 percent a year. At that pace, its profit roughly doubles in five years, so today's P/E of 20 becomes a P/E of about 10 on future earnings if the price holds still. Company B's earnings shrink 5 percent a year, so its P/E of 20 drifts toward 27 on the same flat price. The same multiple describes a compounding machine in one case and a melting asset in the other.
Now change one external thing: rates rise. The market decides it will only pay 15 times earnings for both. Company A falls from 40 to 30. Company B falls from 10 to 7.50. Neither company sold one fewer product. Neither reported bad news. The discount rate underneath every valuation moved, and both prices adjusted. This is the mechanics behind the rate sensitivity covered earlier in this level, and it is why a "cheap" multiple in one rate environment can be expensive in another.
| Variant | What it compares | What it is best at |
|---|---|---|
| Trailing P/E | Price vs last 12 months of reported EPS | Grounding the valuation in audited, finished results |
| Forward P/E | Price vs next 12 months of estimated EPS | Pricing expected growth, spotting when expectations shift |
| Sector-relative P/E | The stock vs its industry peers | Finding companies priced out of line with direct competitors |
| Market-relative P/E | The stock vs the broad index average | Gauging how much expectation is embedded versus the whole market |
The P/E Ratio, Answered
Is a low P/E always a bargain?
No. A low multiple often prices in declining earnings, structural problems, or a one-time profit that will not repeat. It is a signal to investigate, not a green light.
What is a good P/E ratio?
There is no universal good number. A good P/E is one that is low relative to the company's growth rate, its own history, and its peers, in the current rate environment. Judge it in context or do not judge it at all.
Why did the whole market's P/E fall when rates rose?
Because higher rates raise the return on safe alternatives and increase the discount applied to future profits, so investors pay fewer years of earnings for the same stocks. The market's average multiple compresses even when no company's earnings change.
Can P/E be negative?
Mathematically yes, whenever EPS is negative, but the result carries no information. Loss-making companies need other measures, and the P/B ratio, covered in the next lesson, is one of the first places to look.
Next up is the price-to-book ratio, which values a company against what it owns rather than what it earns, and which keeps working in exactly the situations where the P/E goes silent.