Multi-Timeframe Thinking
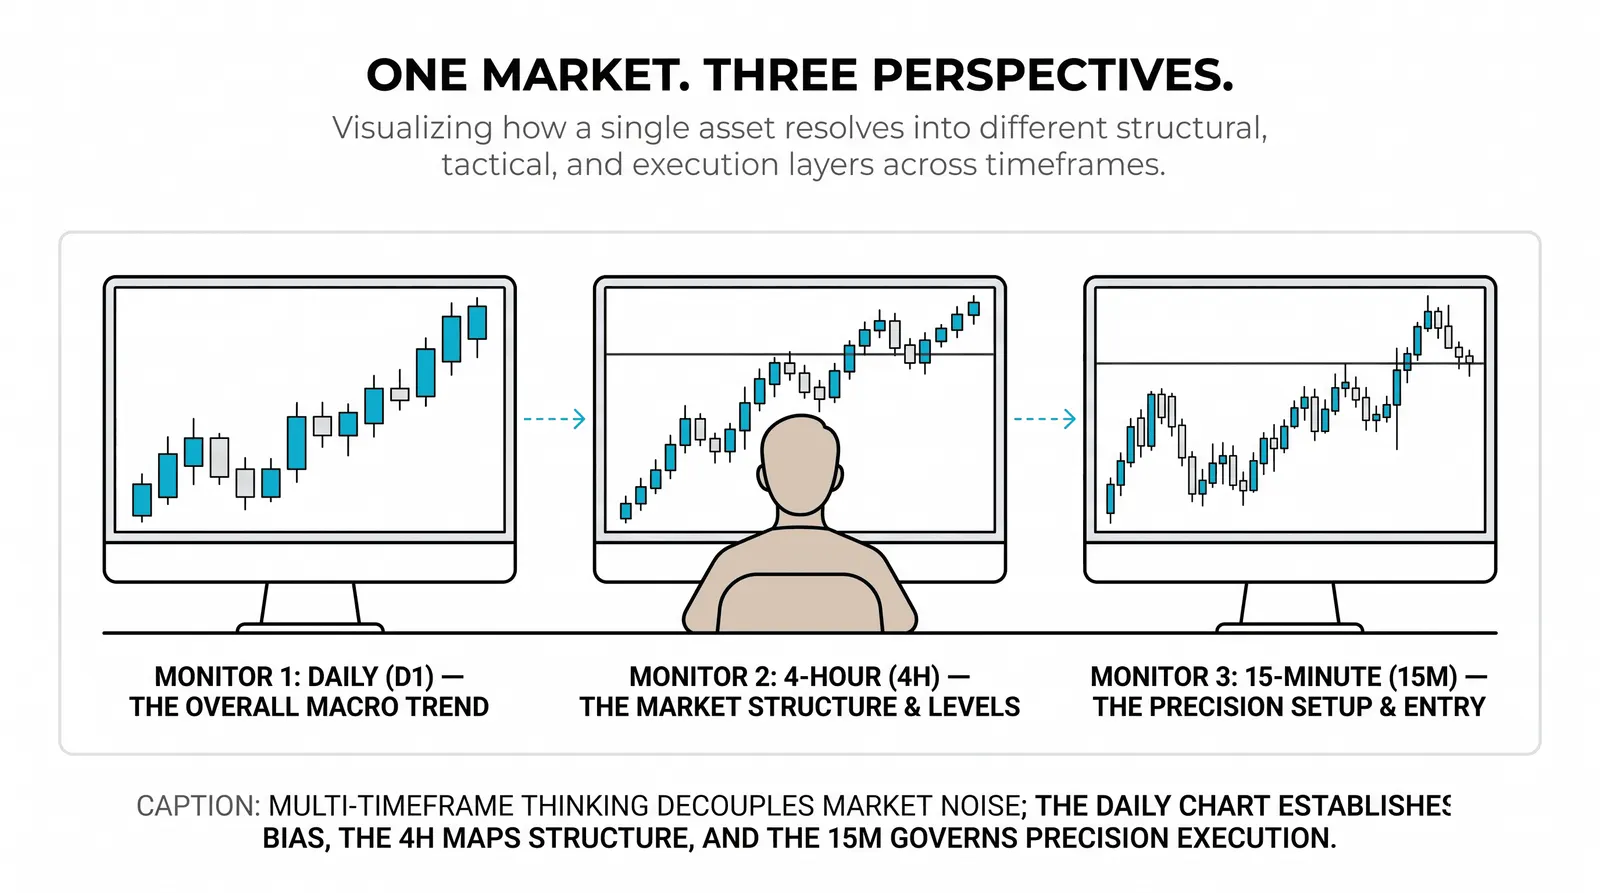
Multi-timeframe thinking means reading the same market on more than one chart interval at the same time, usually a higher one for direction and a lower one for timing the entry. You are not looking for more information. You are looking at the same price from two or three distances so each chart can answer a different question.

One timeframe gives you a sentence, and multi-timeframe reading gives you the paragraph; the words stop changing meaning once you can see what came before them. The idea fits in a sentence; the habit takes weeks. Everything else is execution.
What Multi-Timeframe Reading Actually Is
Strip away the jargon and this is simple. The same price gets sliced at two or three speeds. A daily chart compresses weeks into a few candles. A 1-hour chart of the same market stretches those same days into detail. Nothing new appears. You just see the same story at different resolutions.
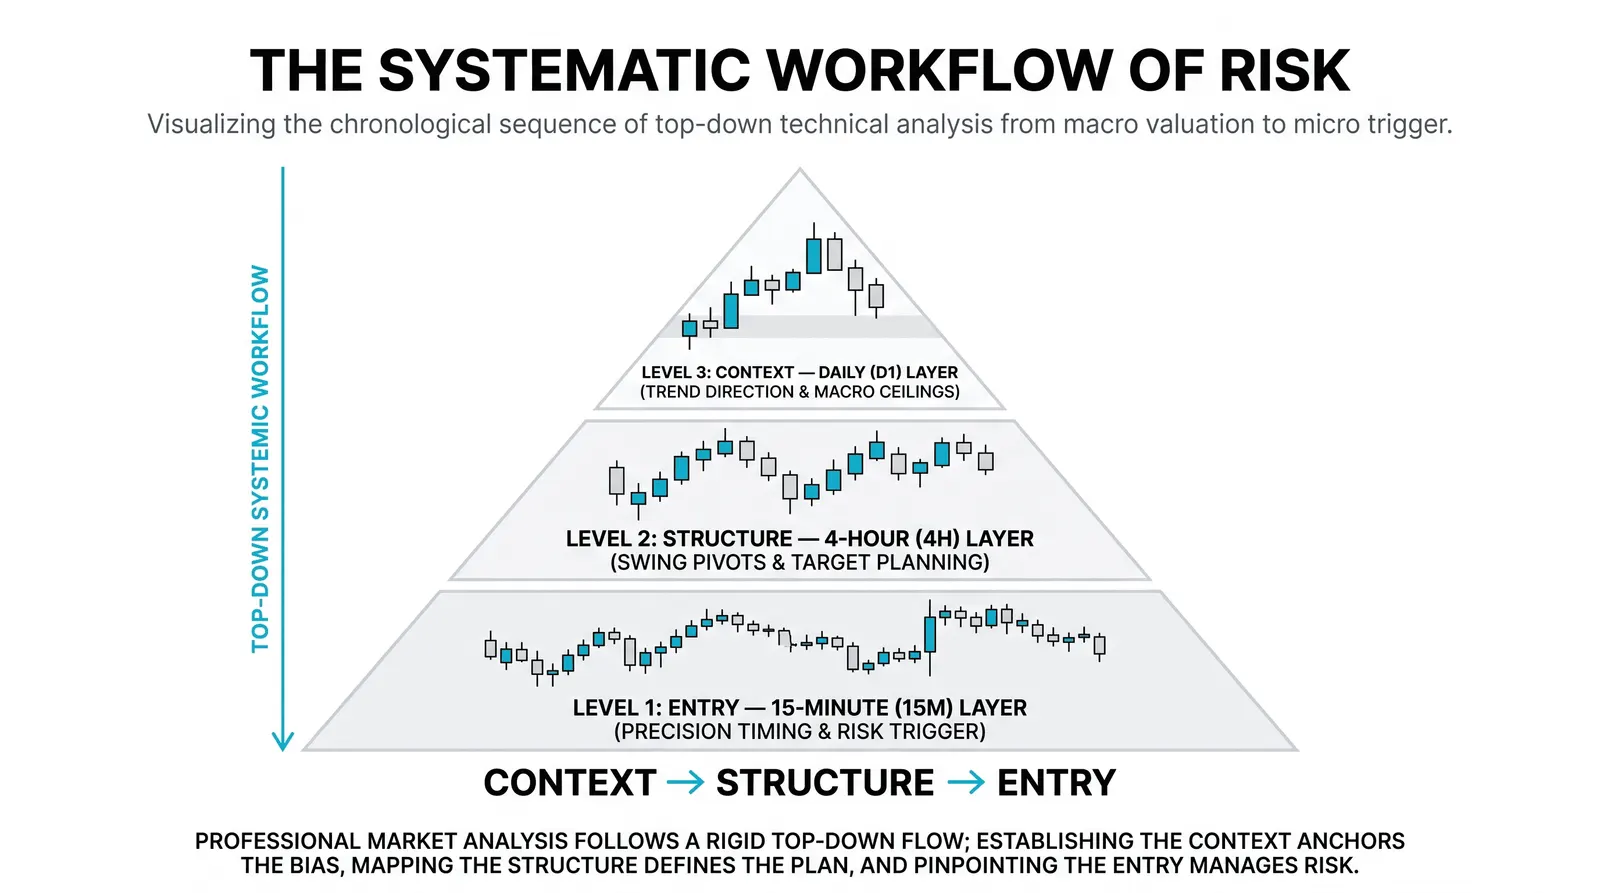
Multi-timeframe thinking is not more indicators. It is not more trades. It is a reading order. You start at the top, on the slow chart, and work down. Each layer has one job:
- The higher timeframe answers: which way is this market actually moving, and where are the levels that matter?
- The middle timeframe answers: is price approaching one of those levels, and how is it behaving as it gets there?
- The lower timeframe answers: is there a trigger here, right now, that justifies entry?
Read top-down, always. If you start on the fast chart, you will fall in love with a pattern before you know what it is sitting inside. That is backwards, and it costs money.
The Problem a Single Timeframe Creates
Every timeframe hides something. That is the part nobody tells beginners. A chart does not just show you the market. It also decides what you cannot see.
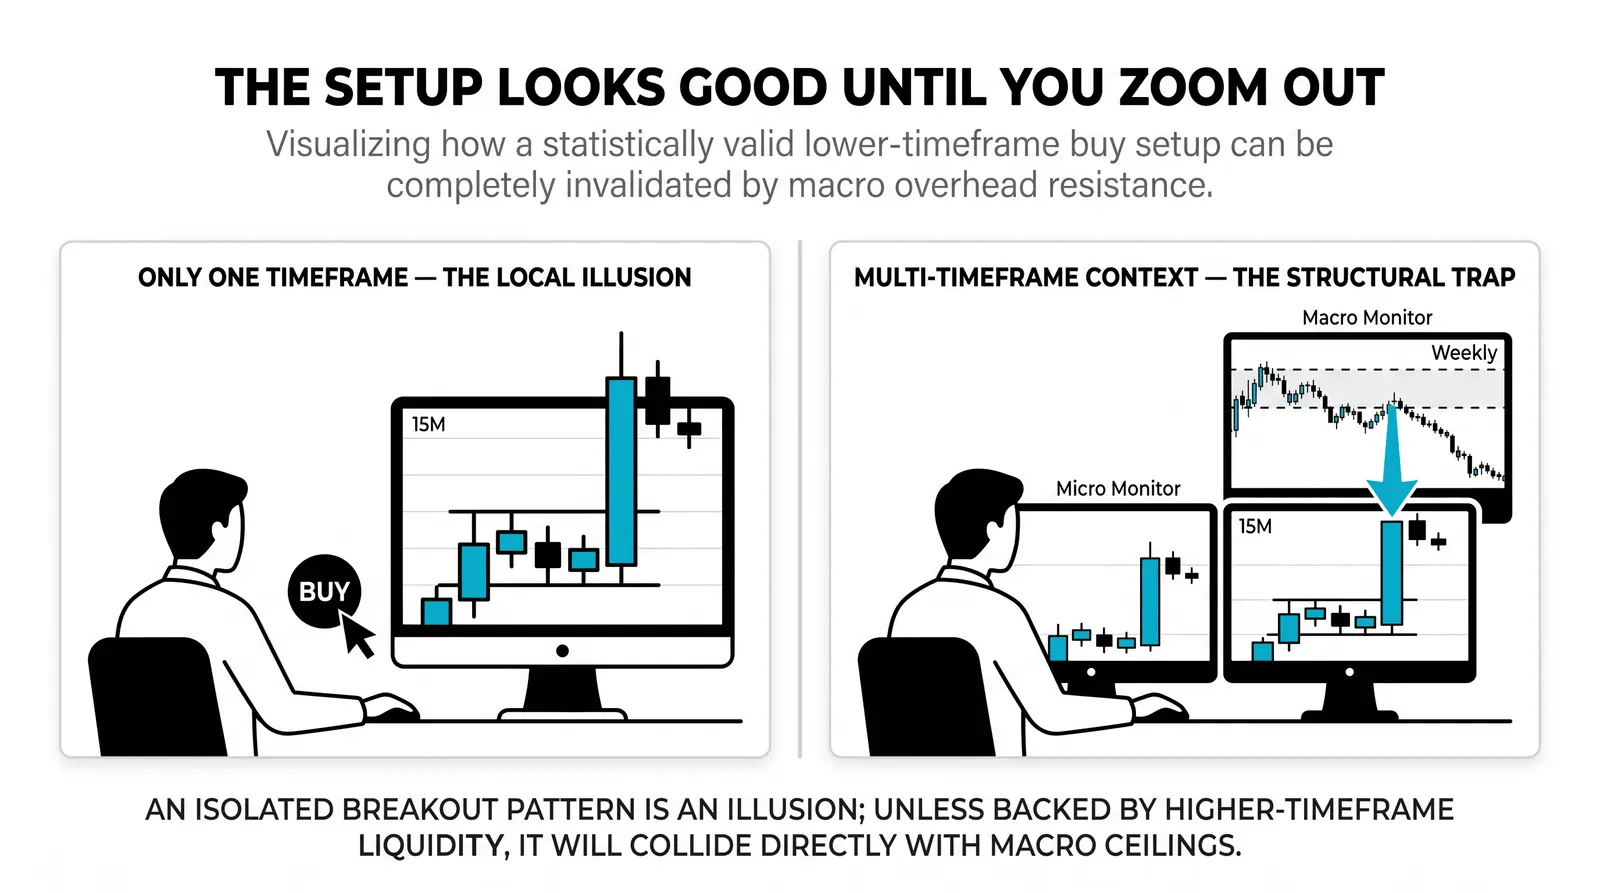
Take a clean 5-minute breakout. Volume expands, the candle closes strong, everything looks textbook. Now zoom out and that breakout is landing directly on top of a daily downtrend, right into a resistance level that has rejected price three times. It is a trap with good lighting.
The reverse happens too. A scary red daily candle can look like the start of a collapse. Pull up the weekly and it is one pullback bar inside a healthy uptrend, touching nothing important. Traders who only watch the daily sell the bottom of a dip. Traders who only watch the 5-minute buy the top of a rejection.
One chart, one blind spot. You cannot fix this with a better indicator, because the problem is not the tool. The problem is the frame.
How the Timeframes Talk to Each Other
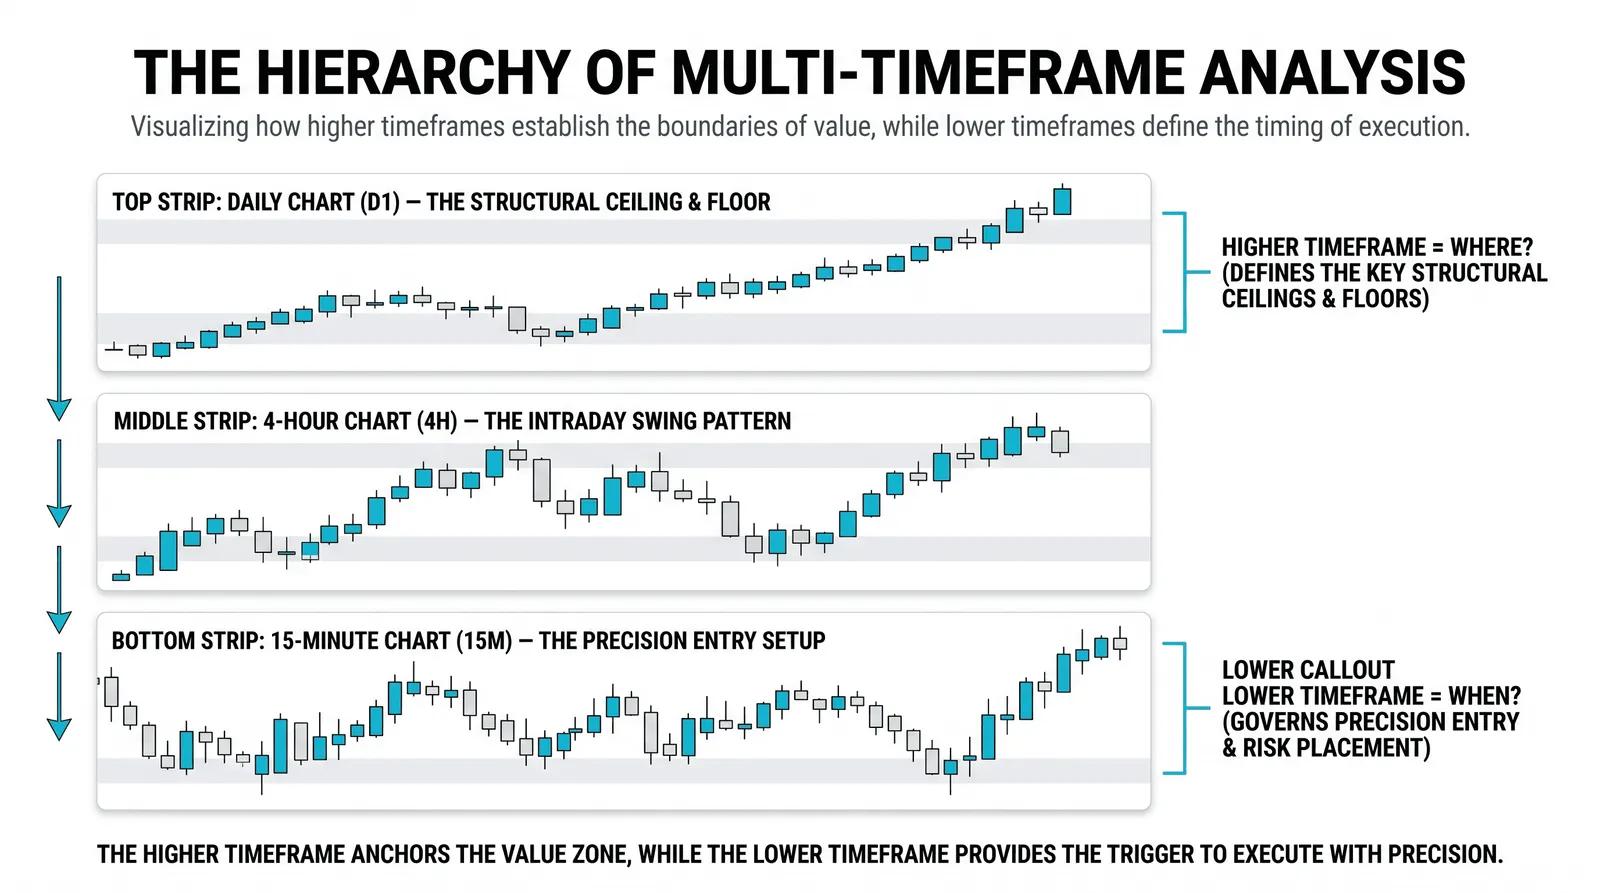
Think of the relationship as a chain of command. The higher chart sets direction and marks the levels that matter: the trend, the major support and resistance, the last swing high and low. It does not tell you when to enter. It tells you which side you are allowed to be on.
The lower chart waits. Its only job is to watch price reach one of those higher-timeframe levels and then produce a trigger: a rejection wick, a break of a small structure, a shift in momentum. No level reached, no trade, no matter how pretty the small chart looks.
A common rule of thumb: pick intervals roughly four to six times apart. Daily and 1-hour. 4-hour and 15-minute. Weekly and daily. If the charts are too close together, like 1-hour and 45-minute, they show nearly the same picture and you learn nothing. If they are too far apart, like weekly and 5-minute, the connection between them breaks and the lower chart becomes noise.
Two charts is enough for most traders. Three is the ceiling. Past that you are collecting opinions, not reading price.
A Worked Example With Round Numbers
Here is a hypothetical trade, built the way the chain of command is supposed to work.
The daily chart shows a clear uptrend. Higher highs, higher lows. The last significant swing low sits at 44. Price has run up to 52 and is now pulling back. On the daily, this is just a dip inside a trend. Nothing broken.
Drop to the 4-hour chart. Price has fallen from 52 to 46, and the selling is visibly slowing right at that zone. Two candles print long lower wicks near 46, meaning buyers keep rejecting lower prices. The middle chart has done its job: price reached a level that matters, and it is reacting.
Now the 1-hour chart. Price breaks back above 47, a small lower-timeframe structure level. That is the trigger. The trade:
- Entry: long at 47.2, after the 1-hour close above 47.
- Stop: under 45.8, beneath the wicks and the reaction zone. Risk of 1.4 per unit.
- Target: the prior high near 52. Reward of 4.8, a bit better than 3-to-1.
Three charts, three jobs, one trade. The daily said longs only. The 4-hour said the level is holding. The 1-hour said now. Remove any one of them and the trade gets worse: without the daily you might short the pullback, without the 4-hour you cannot see the rejection, without the 1-hour you are entering blind with a wide stop.
The Mistakes That Ruin It
The first mistake is chart-hopping until some chart agrees with your hope. You want to be long, the daily says no, so you check the 4-hour, then the 1-hour, then the 15-minute, and eventually something somewhere looks bullish. That is not analysis. That is shopping for permission.
The second mistake is treating conflicting timeframes as paralysis. A bullish daily and a bearish 1-hour is not a contradiction. It is information: the market is pulling back inside an uptrend, and your job is to wait for the lower chart to resolve in the direction of the higher one. Conflict between timeframes is normal. It is the default state of any market that is not in a vertical move.
The third mistake is staring at five intervals at once and drowning. More charts past three does not add clarity. It adds hesitation. If two charts disagree and you cannot act, the answer is almost never a fourth chart. The answer is a smaller position or no trade.
Be blunt with yourself here: if you keep switching timeframes mid-trade to feel better about a losing position, you are using the charts as anesthesia.
Higher, Middle, and Lower: Who Does What
| Higher timeframe | Middle timeframe | Lower timeframe | |
|---|---|---|---|
| The question it answers | Which direction am I allowed to trade? | Is price at a level that matters, and how is it behaving? | Is there a trigger right now? |
| What it sets | Trend, key support and resistance, swing highs and lows | The zone of interest and the quality of the reaction | Entry price, stop placement, trade timing |
| What it must never be used for | Precision entries and tight stops | Deciding direction against the higher chart | Choosing the overall direction of the trade |
Notice the last row. Most multi-timeframe errors come from letting a chart do a job it was never assigned. The 5-minute chart does not get a vote on the trend. The weekly chart does not get a say in your stop placement.
Questions About Multi-Timeframe
How many timeframes should I watch?
Two is enough, three is the maximum. One for direction, one for the trigger, and optionally one in between to read the reaction at the level. Beyond three, each extra chart adds doubt faster than it adds information.
Which pairs of timeframes work together?
Pairs spaced roughly four to six times apart work best: daily with 1-hour, 4-hour with 15-minute, weekly with daily. Too close and the charts duplicate each other. Too far apart and the lower chart loses all connection to the higher one's levels.
What if the timeframes disagree?
Disagreement usually means a pullback, not a broken method. The higher timeframe wins the argument about direction, and you simply wait for the lower timeframe to stop fighting it and align. If you cannot wait, skip the trade. No alignment, no entry.
Does multi-timeframe work for day trading too?
Yes, and arguably it matters more there because intraday moves are noisy. A day trader might use the daily for direction, the 1-hour for levels, and the 5-minute for entries. The chain of command is identical; only the labels on the charts change.
You now have every major trading style on the table, plus the lens to read any of them properly. The next step is matching a style and a timeframe stack to your actual life: your hours, your patience, and your temperament. That choice, made honestly, will do more for your results than any setup you will ever learn.