Medium Term Timeframes
Medium term timeframes are the 1-hour and 4-hour charts, and they sit in the middle ground of chart speed: enough bars to show real structure, enough compression to filter out most of the intraday noise. The 1-hour and 4-hour sit in the middle seat: close enough to read the road, wide enough to see where it leads. Most working swing traders live here. Most day traders check here before they act anywhere else. This lesson shows you what these charts actually display, why they became the default, and where they stop being useful.

What These Charts Actually Show
Each candle on a 1-hour chart holds one hour of trading. Each candle on a 4-hour chart holds a four-hour chunk, which on many markets lines up roughly with a session block: Asia, Europe, or the US morning.
That compression changes what you can see. On a 5-minute chart, a pullback looks like chaos. On the 1-hour, the same pullback becomes three or four red candles against a rising structure, and you can judge it calmly.
Intraday structure becomes visible here. Higher highs and higher lows, the levels where price stalled twice, the range it has respected all week. You read it bar by bar instead of tick by tick.
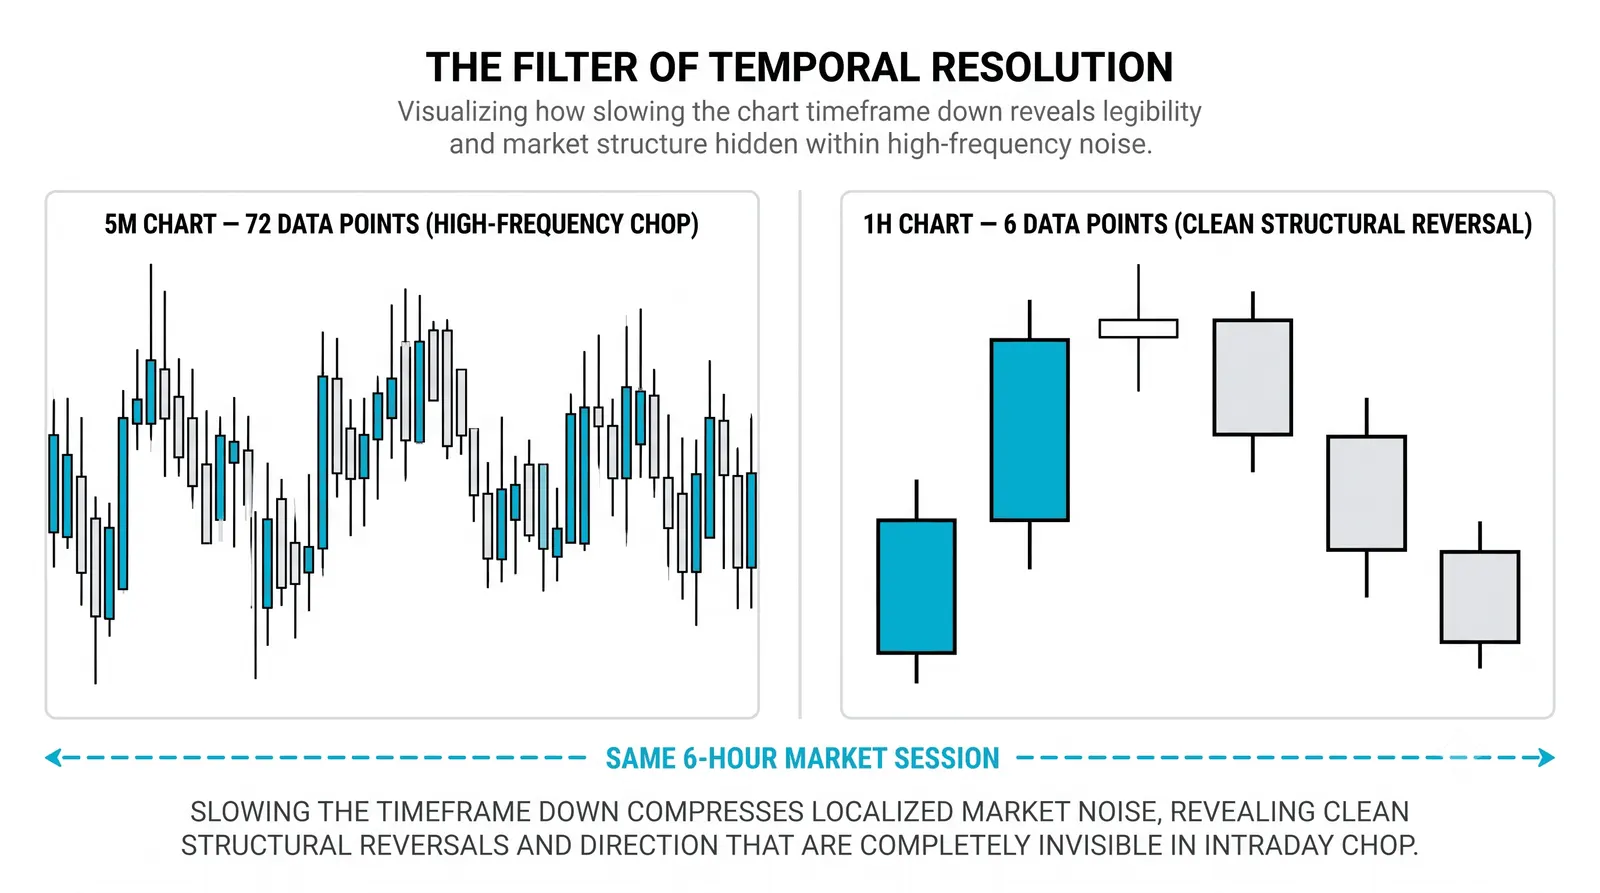
Multi-day swings also fit on one screen. A two-week move that would be thousands of 5-minute candles becomes forty or fifty 4-hour bars. You can see the whole swing, its corrections, and its current position without scrolling.
Why So Many Traders Settle Here
Swing traders use the daily chart to set direction, then drop to the 4-hour or 1-hour to time the actual entry. The daily says the trend is up and price is pulling back to support. The 4-hour says when the pullback is losing steam. That division of labor is the standard workflow.
Day traders use these charts differently. They may execute on the 5-minute or 15-minute, but they keep the 1-hour open to hold session context. A buy signal on the 5-minute means little if the 1-hour shows price pressing into a ceiling it has failed at three times.
The speed is the appeal. These charts are fast enough to act on. A new signal appears every hour or every four hours, so you are not waiting days between decisions. At the same time, they are slow enough to think between bars. You can see a candle close, walk away, plan, and come back.
That thinking time is not a luxury. It is where most good decisions happen.
The 1-Hour Versus the 4-Hour
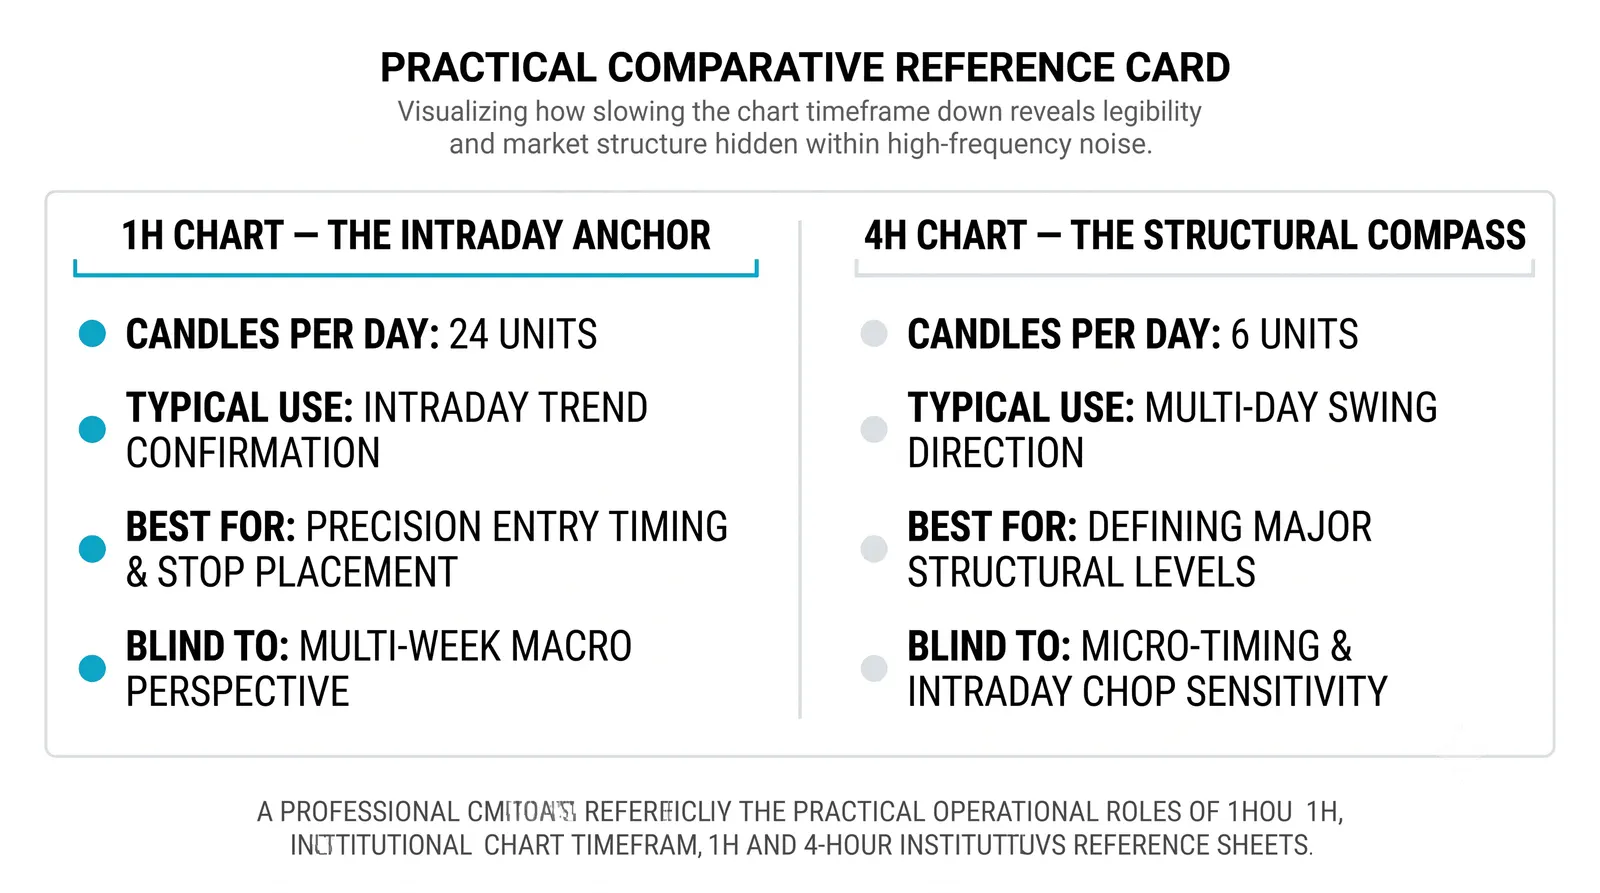
The 4-hour runs calmer. Fewer bars per day means fewer signals, and the levels it marks tend to be spaced wider apart and respected longer. A support zone on the 4-hour usually took real volume to build.
The 1-hour gives you six times the bars. That means more precision. You can tighten an entry, place a stop behind a nearer level, and reduce the distance between being wrong and knowing you are wrong.
The cost is noise. More bars means more false signals. A breakout that looks convincing on the 1-hour can be a random flicker on the 4-hour. Traders who live on the 1-hour get shaken out more often and pay more in spread and fees for the privilege.
Neither is better. They answer different questions. The 4-hour asks whether the move is real. The 1-hour asks where exactly to get in.
A Worked Example
Here is a hypothetical with round numbers. A stock has climbed in a clean uptrend from 40 to 52 over several weeks. The daily chart shows steady higher lows and no warning signs.
Then Wednesday prints a big red daily candle, dropping from 51 to 48.50. On the daily alone, it looks like the trend might be breaking. Some traders would exit on that bar.
Now open the 4-hour chart of the same Wednesday. The first bar drops hard. The second bar drops less. The third bar stalls right at 48.50, a zone where price based for several days two weeks earlier. The fourth bar closes green, back above 49. Buyers stepped in, bar by bar, at a level you already knew about.
The daily said dip, maybe trouble. The 4-hour said pullback ending at known support. Then the 1-hour gave the trigger: a break above 49.50 on Thursday morning, with the prior hour's low as a logical stop. Same market, same day, three different answers depending on the timeframe. The medium term charts are what turned a scary red candle into a planned entry.
What They Cannot Tell You
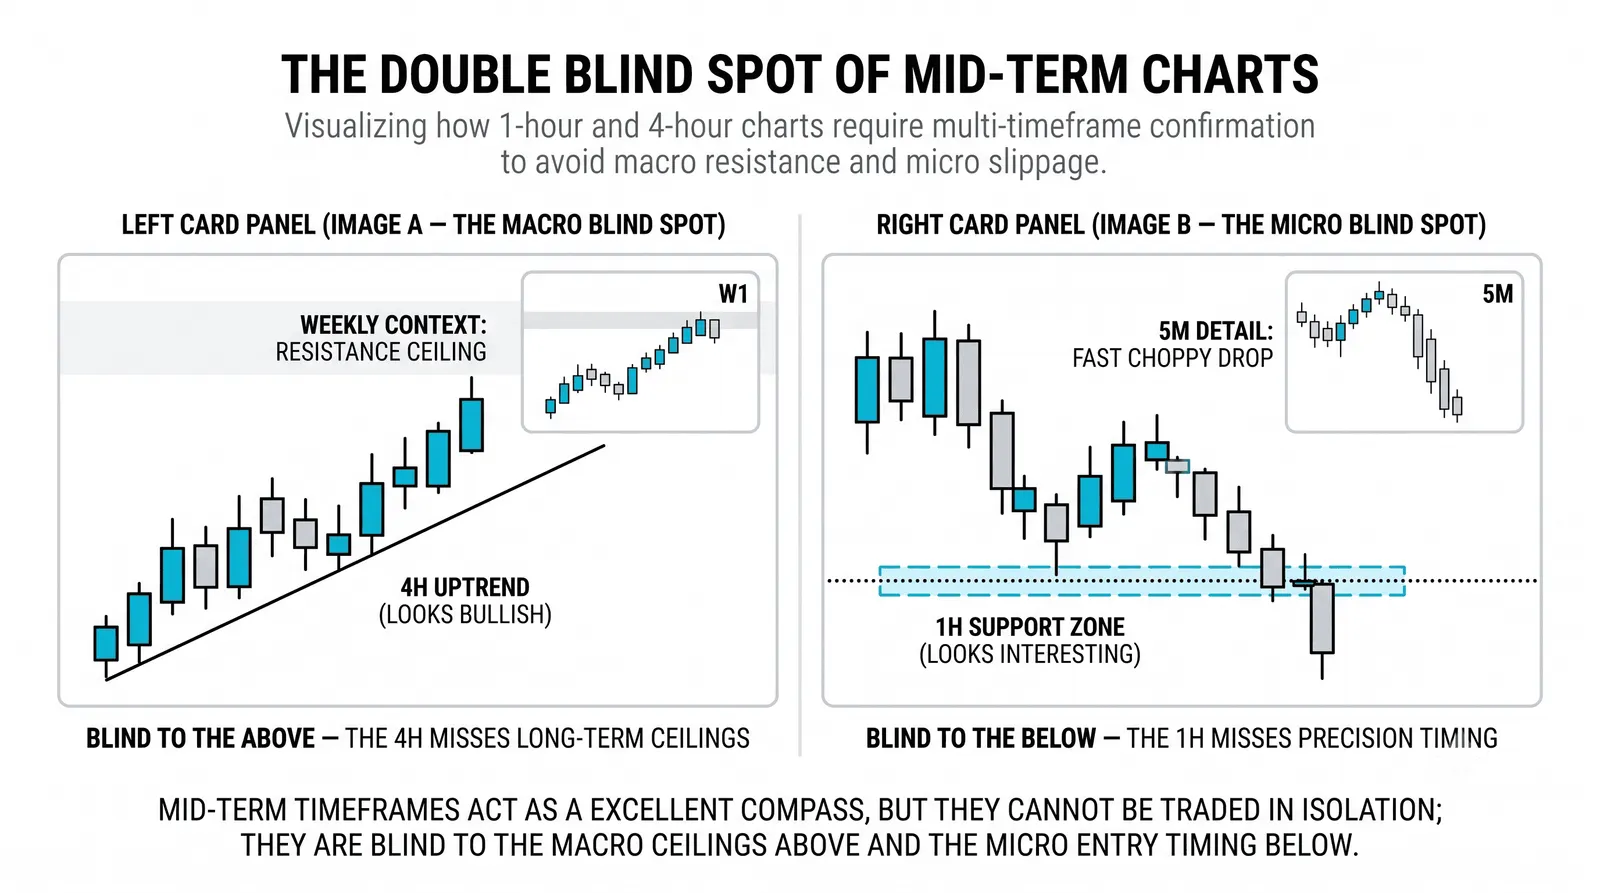
These charts will not show you the biggest picture. A 4-hour chart of the last two weeks cannot tell you whether the market is in a multi-month uptrend or a multi-month decline. That context decides whether your long is swimming with the current or against it.
Plenty of traders take a clean 4-hour buy signal straight into a weekly downtrend and wonder why the "perfect setup" failed. The setup was fine. The direction was wrong, and only a higher timeframe would have shown it.
The fix is a habit, not a skill. Before you act on any 1-hour or 4-hour signal, glance at the daily and weekly. Ten seconds. If the higher timeframe disagrees with your trade, the burden of proof is on the trade, not on the trend.
The Three Charts Side by Side
| 1-Hour | 4-Hour | Daily | |
|---|---|---|---|
| One candle holds | One hour of trading | A four-hour session block | A full trading day |
| Typical use | Entry timing, tight stops | Swing entries, structure reading | Direction and trend context |
| Signal frequency | High, several per day | Moderate, one or two per day | Low, a few per week |
| Noise level | High, many false signals | Moderate, most noise filtered | Low, signals are slower but sturdier |
Read the table as a chain of command, not a menu. The daily sets direction, the 4-hour frames the setup, the 1-hour pulls the trigger. Skipping a rank is how traders end up with precise entries in the wrong direction.
Questions About Medium Term Timeframes
Is the 4-hour chart good for beginners?
Yes, and it is arguably the best starting point. Bars close slowly enough that you can think between them, signals are infrequent enough that you will not overtrade, and the structure it shows is clean enough to practice reading trends and levels without the chaos of faster charts.
Why does everyone seem to use the 1-hour?
Because it is the fastest chart that still shows real structure. Anything quicker starts filling with random movement, and anything slower feels too sluggish for traders who want several opportunities a week. It is a compromise, and like most compromises it became popular because it offends nobody.
Should I use both together?
Yes, if you give each one a job. Use the 4-hour to judge whether a move is genuine and where the meaningful levels sit, then use the 1-hour to refine the entry and stop placement. Using both to hunt for independent signals just doubles your noise.
Which session matters on these charts?
The session that drives your instrument matters most. For US stocks, the 4-hour bars covering the New York morning carry the most volume and the most honest price action. For forex, the London and New York overlap usually sets the tone. Thin overnight bars produce weaker signals, so treat them with more doubt.
Once you are comfortable reading the 1-hour and 4-hour, the natural next step is learning how to stack them with the daily and weekly in a single routine, so every trade you take already knows which way the bigger current runs.