False Breakout Detection Using Volume
False breakout detection rests on one habit: checking whether volume behaved the way a real breakout demands. A genuine break expands volume and holds the far side of the level. A false break prints on thin or ordinary volume, closes back inside the range, and leaves everyone who chased it trapped on the wrong side. The price action framework counts failed breakouts among the highest-probability trades in trading, precisely because everyone leaning the wrong way becomes fuel for the move back.

Think of a movie trailer: the loudest moments in the trailer may not be in the film at all, and the most dramatic spike on the chart may not be in the trend either. The spike is advertising. Volume tells you whether anyone actually bought a ticket.
The previous lesson in this block defined what validating volume looks like on a genuine break: expansion through the level, acceptance beyond it, follow-through. This lesson is the mirror. You are reading the break that fails its own test, and learning to read it fast enough to act on the failure rather than become its fuel.
What a False Break Prints
The signature has three parts, and all three are visible without any indicator beyond price and volume.
First, the push beyond the level happens on volume at or below average. A real break needs new money with size behind it. When price pokes through a well-watched level and the volume bars look ordinary, nobody with real conviction joined the move. The break ran on stops being triggered and on small traders chasing, not on committed capital.
Second, the close comes back inside the range. The intraday excursion does not matter nearly as much as where the bar settles. A close back inside the old boundary means the market auctioned higher, found no buyers willing to hold the new ground, and retreated. The level held from the other side.
Third, the candles left behind carry long shadows beyond the extreme. Those upper wicks above a range top, or lower wicks below a range floor, are the physical record of rejection. Price went there, was refused, and came back. One shadow can be noise. Repeated shadows at the same extreme, each on unremarkable volume, are a pattern of refusal.
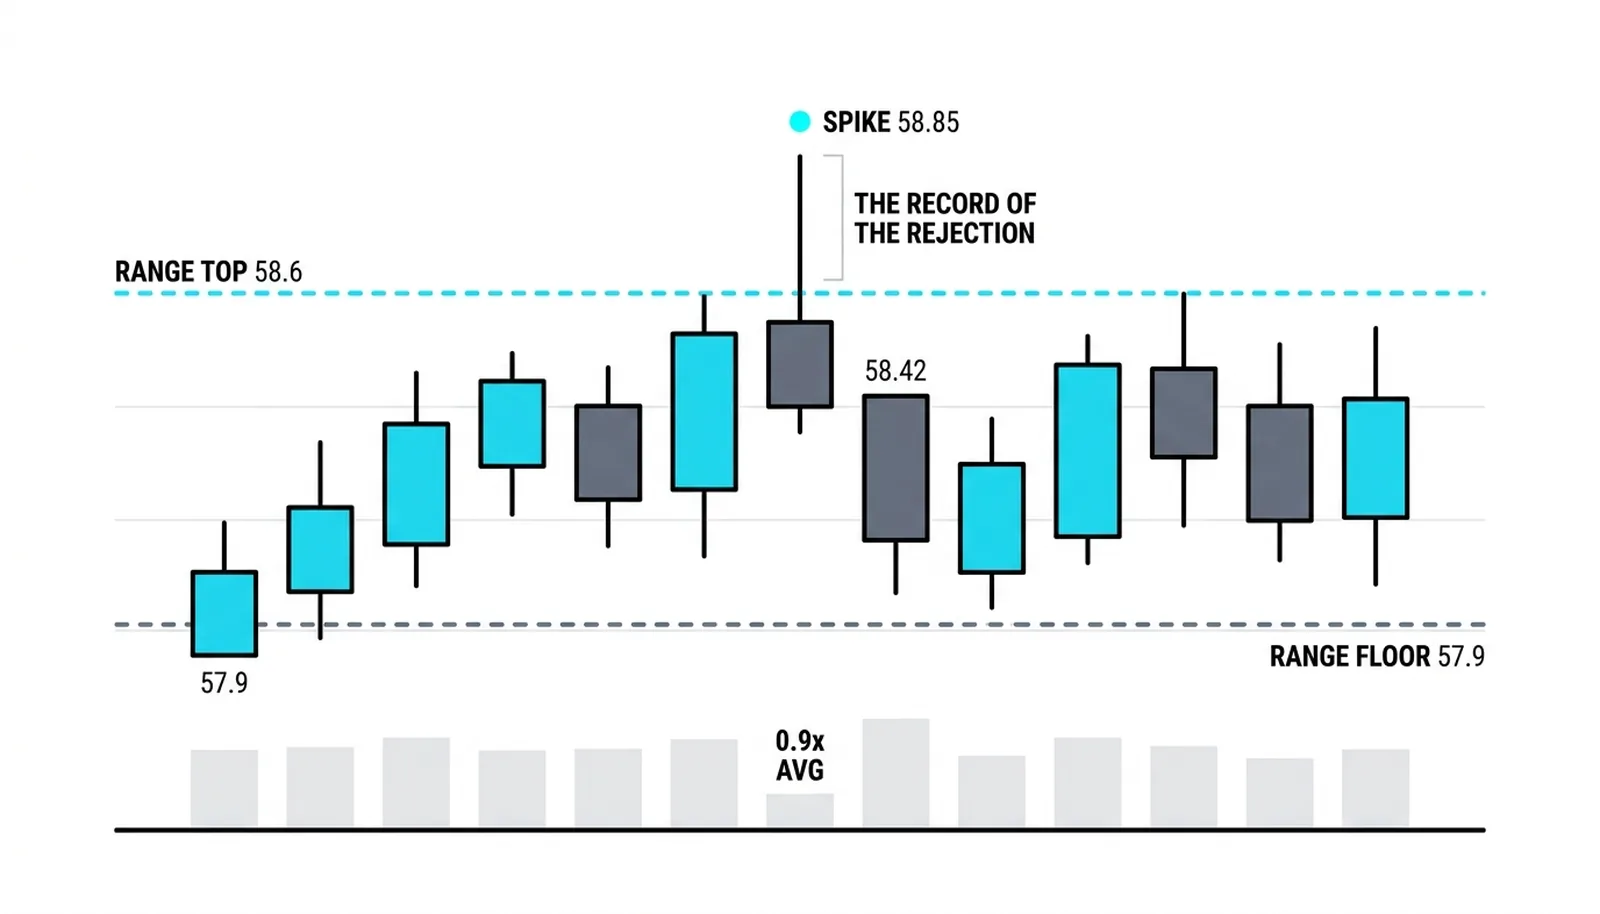
Volume price analysis describes this kind of price action as the market testing a level and finding no support for the move, with volume exposing the weakness that the price spike alone conceals.
None of this requires a new tool. It requires you to grade the break against the standard the breakout lesson already set, and to accept the grade honestly.
The Upthrust and the Crowd
The price action framework frames the false break above a range top as an upthrust : the mirror image of the Wyckoff spring . A spring is a false break below support that marks accumulation. An upthrust is a false break above resistance that marks distribution. Strong hands use the spike above the level to sell into the demand that the breakout itself creates.
The meta-lesson matters more than the label. Become intimately familiar with the patterns associated with the failure of the patterns you trade. The failure of your setup is often the better setup. A trader who only studies what a good breakout looks like is defenseless when the break fails. A trader who studies the failure has two trades for every pattern.
The crowd makes the failure worse, and the crowd is why it works. The public seizes on every breakout as proof that a new trend is starting. That belief sends a wave of buy orders through the level at exactly the moment the move is weakest. When the break fails, those buyers are trapped: long from above the range top, underwater within a bar or two, and facing a decision they did not plan for.
Their exit becomes the move. Every trapped buyer who sells adds downward pressure, and every short seller who read the failure adds more. The return through the range is not a gentle drift. It is a liquidation. That is why the price action framework treats the failed breakout as a high-probability trade rather than a curiosity: the losing side is pre-committed, and their exits are predictable.
The blunt version: the breakout crowd writes the fuel invoice for the reversal.
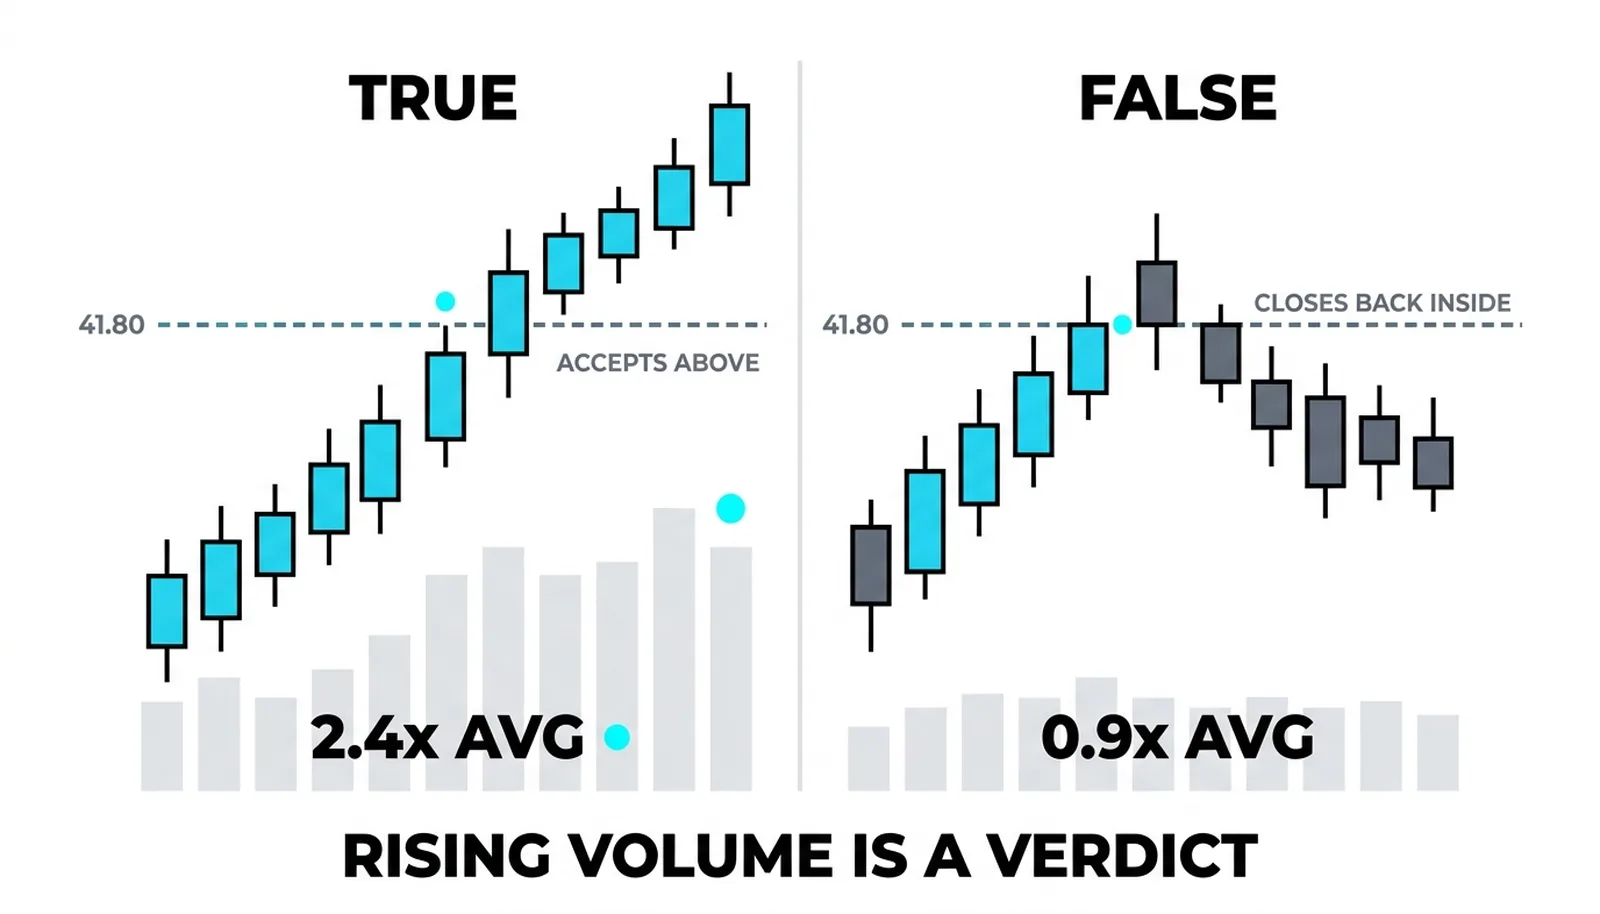
| Feature | True breakout | False breakout | The response |
|---|---|---|---|
| Volume on the break | Clearly above the recent average | At or below average | Grade the break against volume history before trusting it |
| The close | Holds the far side of the level | Back inside the range | Acceptance validates; rejection voids the break |
| The candles | Solid bodies trading beyond the level | Long shadows beyond the extreme | The wicks are the physical record of refusal |
| The re-entry leg | No re-entry; price continues away | Expanding volume back into the range | The mirror entry's own confirmation |
The Mirror Entry
The failed break, reversed, is a trade in its own right. You are doing more than avoiding a bad long. You are taking the other side of it.
The structure is simple. Entry comes as price re-enters the range after the failed push, or on the first close back inside. The stop goes beyond the spike extreme, above the high of the upthrust for a short, below the low of a failed downside break for a long. That placement is logical rather than arbitrary: if price exceeds the spike extreme, the failure itself has failed, and the break was real after all.
The target is the other side of the range. A failed break of the top often travels the full height of the range, because the trapped longs exit progressively and the range floor is where the next pool of buyers waits. Conservative traders take partial profit at the midpoint and the rest at the far boundary.
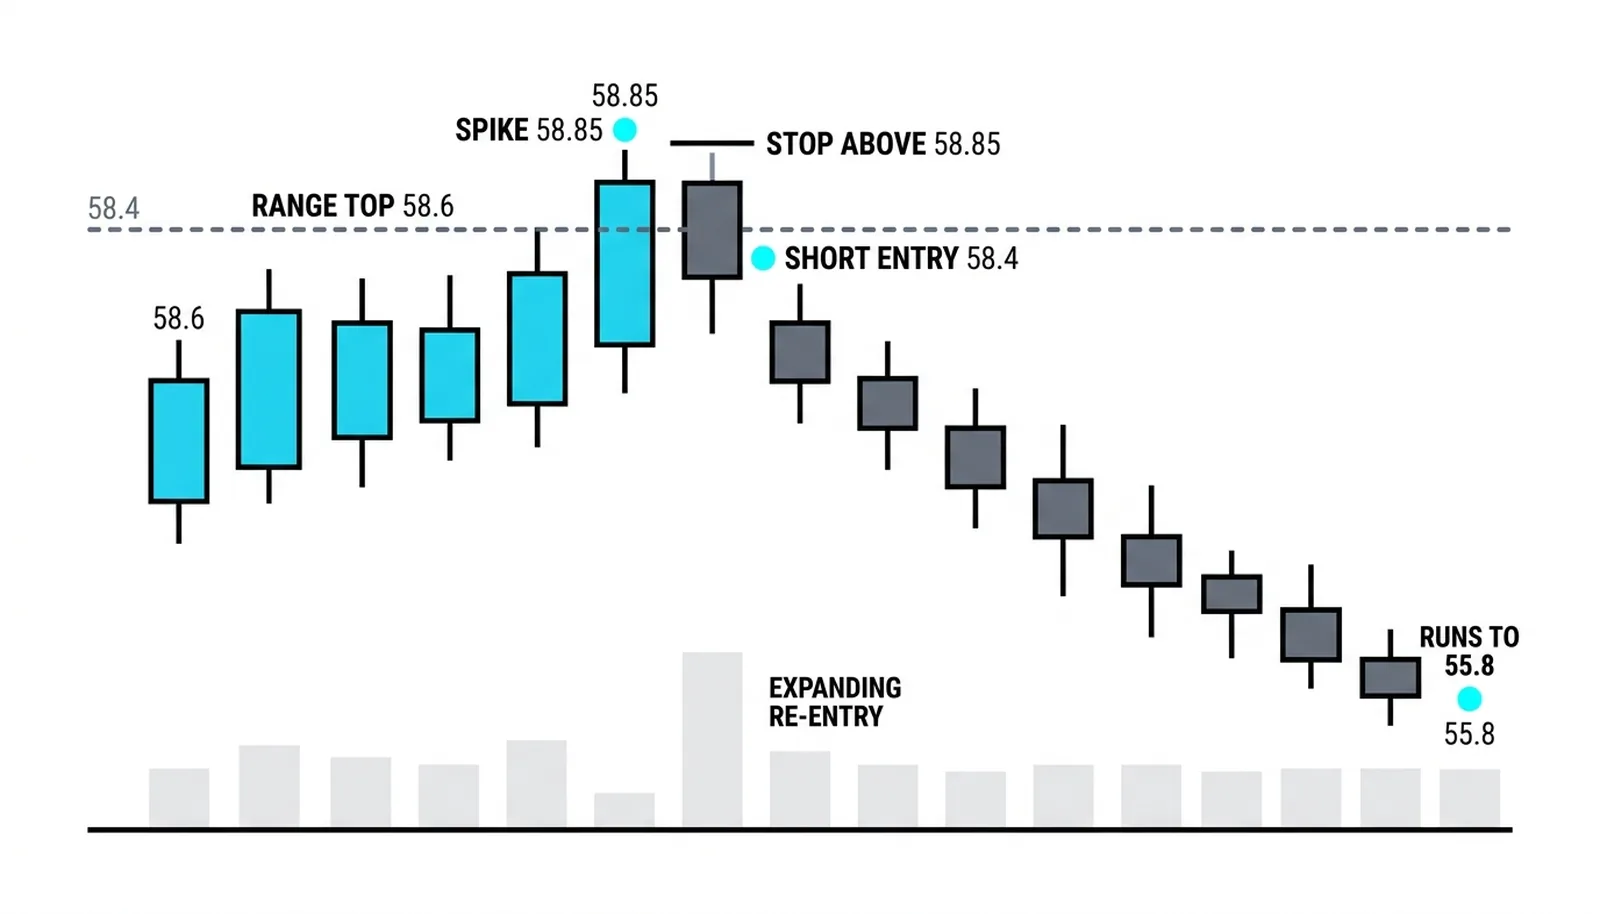
The confirmation that separates a real failure from a wobble is the volume on the re-entry leg. As price comes back through the level and into the range, volume should expand. That expansion says the rejection has participation, that sellers are acting with size rather than price simply drifting back on apathy. A close back inside on shrinking volume is ambiguous. A close back inside on rising volume is a verdict.
Two cautions keep this honest.
First, detection is retrospective by one bar. While the break is printing, it looks real. The volume verdict only lands at the close, or on the next bar's rejection. You cannot know in real time that the spike is an upthrust. So sizing and stop placement on any breakout trade must assume the break may be real until proven otherwise, and any mirror entry must wait for its evidence rather than anticipate it.
Second, not every false break reverses into a big move. Some just fade back into the range and chop sideways for days. The mirror entry needs its own confirmation, the volume expansion on the re-entry leg, and its stop beyond the spike, because the failed break of a failed break is simply a strong breakout. Respect that possibility and the trade stays asymmetric in your favor.
The Spike to 58.85
A hypothetical stock has ranged between 56.90 and 58.60 for three weeks. Both boundaries have been tested multiple times, and regular traders of the name know the levels well.
Stage one: the break attempt. Price pushes through 58.60 and spikes to 58.85. Volume on the day runs at 0.9 times its average. That is the first warning. A genuine break of a three-week ceiling should draw a crowd of new money. Instead the move printed on slightly below-average participation, meaning the push ran on triggered buy stops and small chasers, not on size.
Stage two: the close. The day ends at 58.42, back inside the range. The candle carries a long upper shadow from 58.85. The market went above the ceiling, found no one willing to hold the new ground, and retreated. The breakout buyers from 58.60 to 58.85 are now underwater.
Stage three: the next bar cannot even reach 58.60. Price drifts. The trapped longs begin to exit, and each exit presses price lower. The failure is no longer a suspicion; it is in progress.
Stage four: confirmation. Price breaks 56.90, the range floor, on 1.6 times average volume, and runs to 55.80. The expansion on the downside break is the participation the upside break never had. The failure of the top, followed by a high-volume break of the floor, tells one coherent story: the upthrust was distribution, and the range resolved downward.
The mirror entry, read mechanically: short as price closes back inside the range near 58.40, stop above the spike extreme at roughly 58.90, first target the range floor at 56.90, stretch target a range-height projection toward 55.20. Risk of about half a point, reward of one and a half to three points, with the volume expansion through 56.90 confirming the trade was right.
False Breakout Detection, Answered
What is a false breakout?
A false breakout is a move through a recognized support or resistance level that fails to hold, closing back inside the prior range within a bar or two. Price crosses the line, finds no acceptance on the other side, and retreats, leaving the traders who chased the break trapped on the wrong side of the level.
How does volume reveal a false breakout?
Volume reveals it in two places. The break itself prints on volume at or below average, showing no large participation behind the push, and the reversal back into the range prints on expanding volume, showing committed money driving the rejection. A real breakout reverses that pattern: expansion through the level, then acceptance beyond it.
What is an upthrust?
An upthrust is a false break above the top of a range, the mirror image of the Wyckoff spring below a range floor. It marks distribution: strong hands sell into the demand the breakout creates, price closes back inside the range, and the trapped breakout buyers fuel the decline that follows.
Can you trade a false breakout directly?
Yes, through the mirror entry: enter as price re-enters the range, place the stop beyond the spike extreme, and target the far side of the range. The trade needs its own confirmation, volume expansion on the re-entry leg, because some false breaks simply fade into chop, and a break that exceeds the spike extreme has become a genuine breakout.
The next lesson in this block pulls signal, breakout, reversal, and failure into one read: the complete market picture when price and volume are graded together, bar by bar, as a single piece of evidence.